Microcycle comparison is one of the most underused practices in internal load monitoring — and one of the most valuable.
A single week of RPE data tells you what happened. Comparing that week against previous microcycles tells you where the squad is heading. That difference matters before every session, before every decision.
Whether you're preparing for a competition week, managing a congested fixture run, or coming off a recovery block, the five metrics covered in this article — ACWR, monotony, daily load, strain, and RPE — provide the complete picture you need. This guide explains what microcycle comparison means in practice and how to use it consistently in your coaching workflow.
What Is Microcycle Comparison in Training Load?
A microcycle is the smallest structured unit of a training plan — typically one week. It contains individual sessions, rest days, and matches, organised around the demands of the competitive calendar.
Microcycle comparison is the practice of setting two or more microcycles side by side to identify how load, intensity, and recovery patterns have changed over time. Rather than reading a single week in isolation, coaches use comparison to detect trends that individual snapshots miss.
One week of load data is a number. A series of weeks in sequence is a pattern. And patterns are what drive informed decisions.
Why Does Microcycle Comparison Matter for Coaches?
Internal load data — collected via session RPE × duration, a method validated by Foster et al. (2001) — only becomes meaningful when placed in context. The absolute value is less important than how it compares to what came before.
Consider an ACWR of 1.2 on a Monday morning. Without comparison, you don't know if that represents a safe return from a recovery week or a continued accumulation of load that has been climbing for three consecutive microcycles. That context changes the decision.
Coaches using Fractall consistently report that the shift from reading single-week dashboards to comparing across microcycles is where monitoring starts to genuinely support decisions — not just describe what happened.
Coach Takeaway: Monitoring only creates value when it supports action. That action depends on comparison, not isolation.
The 5 Metrics That Drive Microcycle Comparison
Not every data point needs to be compared across microcycles. These five provide the most complete picture before a session.
| Metric | What It Shows | Why Compare Across Microcycles? |
|---|---|---|
| ACWR | Acute vs chronic load ratio | Reveals if recent load is ahead of or behind the chronic baseline |
| Monotony | Variation in daily load within the week | High monotony across consecutive weeks increases injury risk |
| Daily Load | Session RPE × duration | Tracks volume trends across similar days of the week |
| Strain | Weekly load × monotony | Accumulated stress indicator — more sensitive than load alone |
| RPE | Perceived session intensity | Shows if athlete perception aligns with planned load |
What Is ACWR and Why Does It Matter?
The Acute:Chronic Workload Ratio compares the last 7 days of load (acute load) against the rolling 28-day average (chronic load). Research by Hulin et al. (2016) and others suggests a ratio between 0.8 and 1.3 is associated with lower injury risk.
When comparing microcycles, ACWR shows whether recent training is consistent with what the body has adapted to — or whether there is a spike or drop worth addressing before the next session.
What Does Training Monotony Tell Coaches?
Training monotony measures how much daily load varies within a microcycle. A week where every session carries a similar load produces high monotony. Foster (1998) established that high monotony combined with high strain is associated with increased illness and injury risk.
Comparing monotony across consecutive weeks helps identify if a team is stuck in a repetitive loading pattern — even when total load appears reasonable.
How Is Daily Load Calculated?
Daily load is session RPE × duration in minutes. This is the building block of all internal load metrics. Comparing the same day of the week — Monday's session this week versus Monday across the last four microcycles — reveals whether training intensity is being applied consistently or drifting.
Why Does Strain Accumulate Across Microcycles?
Strain is the product of total weekly load and monotony. It is a more sensitive indicator of accumulated stress than load alone. When strain rises across three or four consecutive microcycles without a planned deload, athlete readiness typically declines before any single metric triggers concern.
What Do RPE Trends Reveal Beyond Session Load?
RPE responses compared across microcycles show whether athletes are perceiving sessions as planned. A coach who designs a moderate Tuesday session but sees elevated RPE across three consecutive weeks has important information — even without GPS data. It may signal accumulated fatigue, or a mismatch between planned and actual intensity.
Real Examples from Sport
Competition week versus training block (football): A head coach at a semi-professional football club compares the current competition week — two matches in five days — against the previous training-only microcycle. ACWR has climbed from 0.95 to 1.4. Monotony is low due to varied demands on match days. Strain is elevated. The comparison tells the coach that Wednesday's field session should be recovery-oriented, not loading.
Pre-season accumulation phase (youth academy): An S&C coach working with a youth football academy tracks six weeks of pre-season. By week four, strain values have increased across three consecutive microcycles without a planned deload. The comparison view reveals the pattern before any athlete has reported injury or excessive fatigue. A deload week is added.
Return from international break: A conditioning coach receives players back from international duty with unknown load histories. Comparing the squad's chronic load baseline against the first full training week back shows ACWR above 1.5 for three players. The coach modifies their individual participation in the opening sessions.
None of these scenarios required GPS. They required consistent RPE collection and a view that places current data against previous microcycles.
Common Mistakes Coaches Make with Microcycle Comparison
1. Comparing structurally different weeks. A competition week and a full training week are not equivalent units. Comparing total load without noting the context produces misleading conclusions. Always account for the structure of each microcycle when interpreting a comparison.
2. Acting on a single metric in isolation. An elevated ACWR without checking monotony or RPE trend may lead to unnecessary load reductions. All five metrics should be read together as a pattern — not one at a time.
3. Skipping comparison when the week feels fine. Patterns that lead to load-related problems often look manageable in the week they develop. It is the comparison across three or four weeks that reveals accumulation. Feeling fine in week three does not mean week four will be fine.
4. Reviewing data reactively rather than proactively. Many coaches review load data after a session ends or after an issue arises. The comparison view is most useful before the next session — as a decision input, not a retrospective audit.
5. Reading team averages without checking individual outliers. A team ACWR of 1.0 can mask individual players at 1.5 or 0.7. Microcycle comparison must be available at both team and individual level to be genuinely useful.
Coach Takeaway: One data point is a number. A pattern across microcycles is insight.
How to Implement Microcycle Comparison Today
You do not need GPS hardware or a data analyst to use microcycle comparison. Here is a practical process for any coaching staff.
- Collect RPE after every session. Use the Borg CR-10 scale. Session RPE × duration in minutes is your internal load value. This is the foundation everything else depends on.
- Record daily loads and track weekly totals. Consistent collection over at least four weeks is what makes comparison meaningful.
- Calculate ACWR, monotony, and strain weekly. These calculations are manageable but time-consuming manually. Automating them removes friction and increases consistency.
- Compare like-for-like microcycles. Competition weeks versus competition weeks. Training blocks versus training blocks. Context must match for comparison to be useful.
- Review before the next session, not after. Schedule your comparison review as the final step before building your session plan.
- Flag elevated strain across two or more consecutive weeks. This is the pattern most associated with accumulated fatigue — and the one most often missed without a comparison view.
For more context on training load concepts, explore the Fractall blog for related guides on ACWR, RPE, and wellness monitoring.
How Fractall Helps with Microcycle Comparison
Fractall's load monitoring features were built to make this process available to coaches without a data analyst or a complex technical setup.
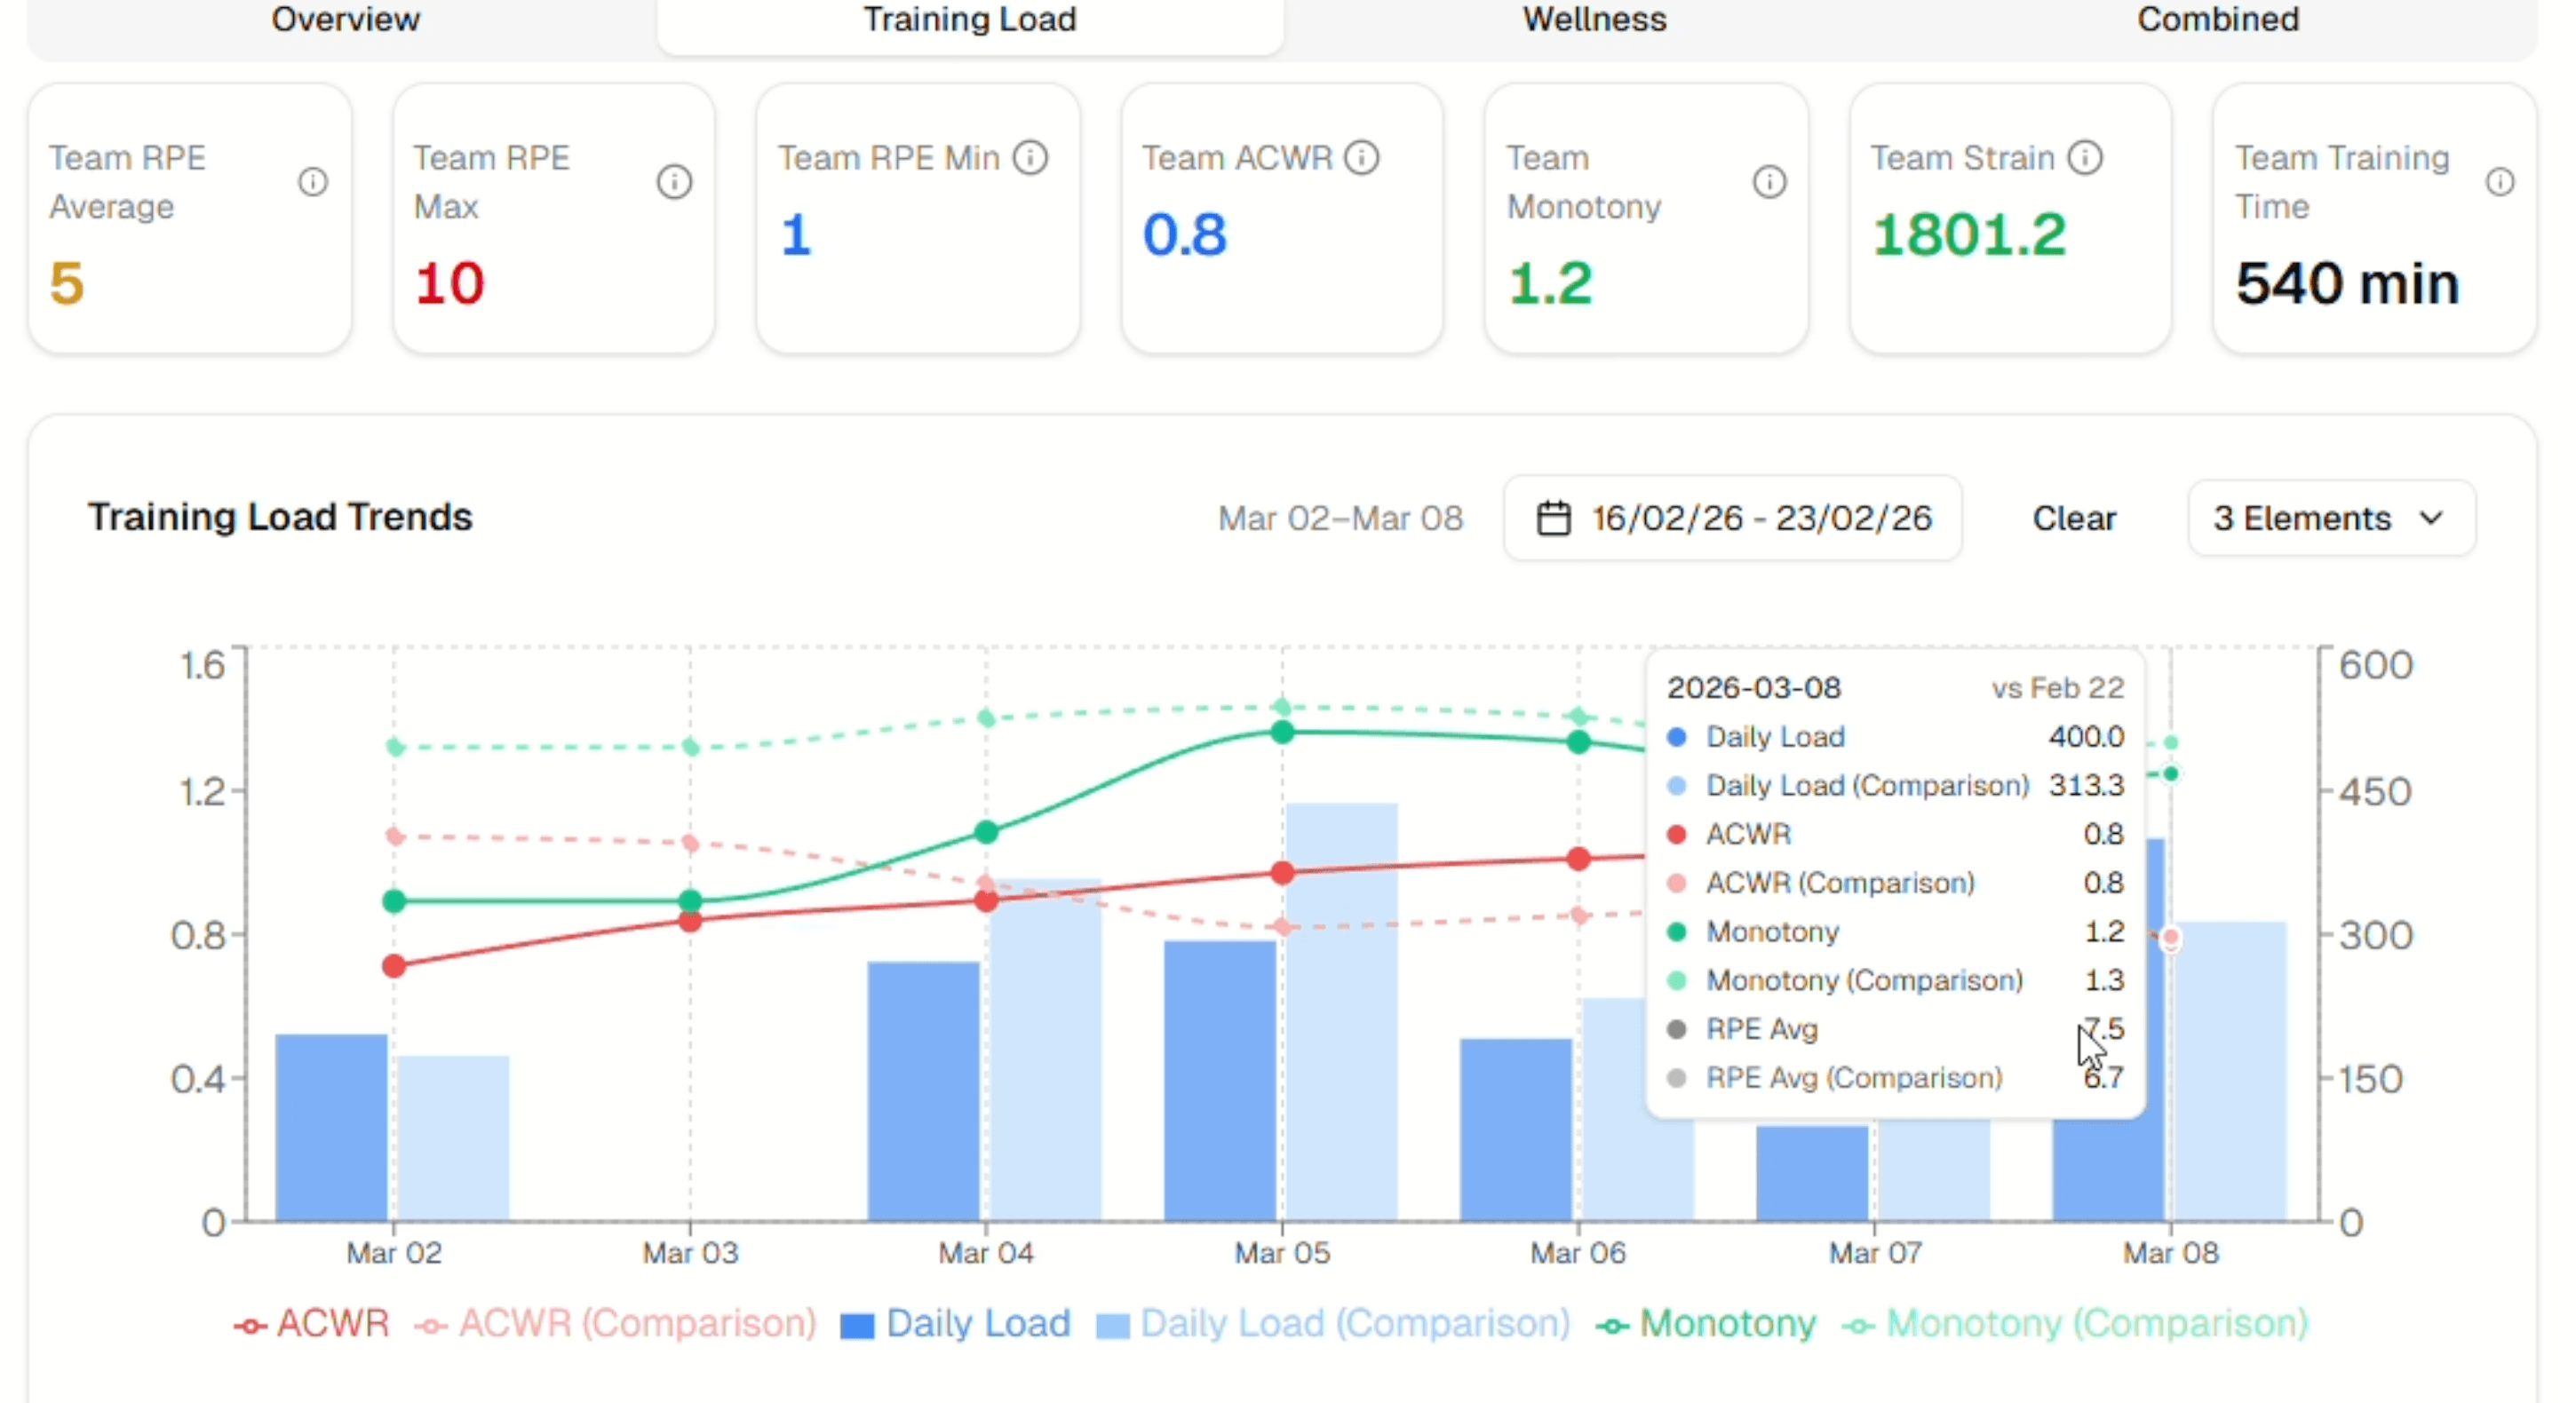
Athletes submit RPE responses after each session via a mobile interface that takes under 60 seconds. Fractall automatically calculates ACWR, monotony, strain, and daily load from that data and surfaces it in a dedicated microcycle comparison view. The view overlays all five metrics across two selected periods in one chart — the pattern is visible immediately, before the next session.
If you're currently managing load data manually, start your free trial to see how comparison across microcycles changes the way you read squad readiness. View pricing plans to find the right option for your club.
Frequently Asked Questions
What is a microcycle in sport? A microcycle is the smallest recurring unit of a training programme — typically one week. It contains individual sessions, rest days, and competitive fixtures. Coaches use microcycles as the basic building block of periodisation, grouping them into mesocycles (3–6 weeks) and macrocycles (full seasons or competitive cycles).
How many microcycles should I compare at once? Comparing two to four microcycles provides the most actionable context for most practical decisions. Comparing the current week against the same phase in the previous mesocycle — for example, competition week to competition week — tends to produce the most useful information for session planning.
What is a safe ACWR range for athletes? Research suggests that an ACWR between 0.8 and 1.3 is associated with lower injury risk, while values above 1.5 indicate that recent load has significantly exceeded chronic capacity. Values below 0.8 may indicate under-preparation ahead of a competitive period. These thresholds support decision-making — they are not clinical standards, and individual athlete context always matters.
How does training monotony relate to injury risk? Training monotony measures the lack of variation in daily load across a week. When combined with high total strain, consistently high monotony has been associated with increased illness and injury risk (Foster, 1998). Structuring training weeks with varied session intensities — alternating high-load, moderate, and recovery sessions — naturally reduces monotony and the accumulated stress that comes with it.
Can I compare microcycles without GPS data? Yes. Internal load data collected via session RPE × duration is sufficient for meaningful microcycle comparison. GPS provides external load data — distance, high-speed running — that adds context but is not required to calculate ACWR, monotony, strain, or daily load. Many coaches at small and medium clubs run effective monitoring programmes using RPE alone.
How often should I review microcycle comparison data? Once per week, before your most demanding session, is the minimum useful frequency. For coaches managing congested fixture schedules or squads returning from international duty, reviewing before every key session allows patterns to be identified and addressed before they develop into problems.
Coach Checklist: Microcycle Comparison
- Collect RPE from every athlete after every session
- Calculate daily load (RPE × duration) and track it consistently
- Review ACWR, monotony, strain, daily load, and RPE as a set each week
- Compare like-for-like microcycles — not structurally different blocks
- Flag elevated strain across two or more consecutive weeks
- Use the comparison view before the next session, not after
- Check individual outliers, not only team averages
Monitoring only creates value when it supports action.
The comparison view is where internal load monitoring earns its place in your coaching process — not as a record of what happened, but as context for what comes next.