

Build an athlete monitoring loop coaches will actually use
A practical interactive guide to turning wellness, sRPE, and training-load data into a weekly decision loop instead of another dashboard nobody opens.
Updated first published
Quick answer
Design the weekly decision, then pick the signals
Quick answer
Framework
Start with the decision loop, not the dashboard
A monitoring system works when each collected signal has a clear review rhythm and a clear action owner.
Collect only useful signals
Review at fixed moments
Close the loop
- 1
Capture
Athletes answer short wellness and sRPE inputs after training.
- 2
Detect
The system highlights changes in load, wellness, pain, and availability.
- 3
Act
The coach adjusts the plan, checks in with the athlete, or documents why no action is needed.
Signals
Use a small set of signals that explain different risks
A good guide page should help the reader understand what each metric is for, when it is useful, and when it can mislead them.
Session load
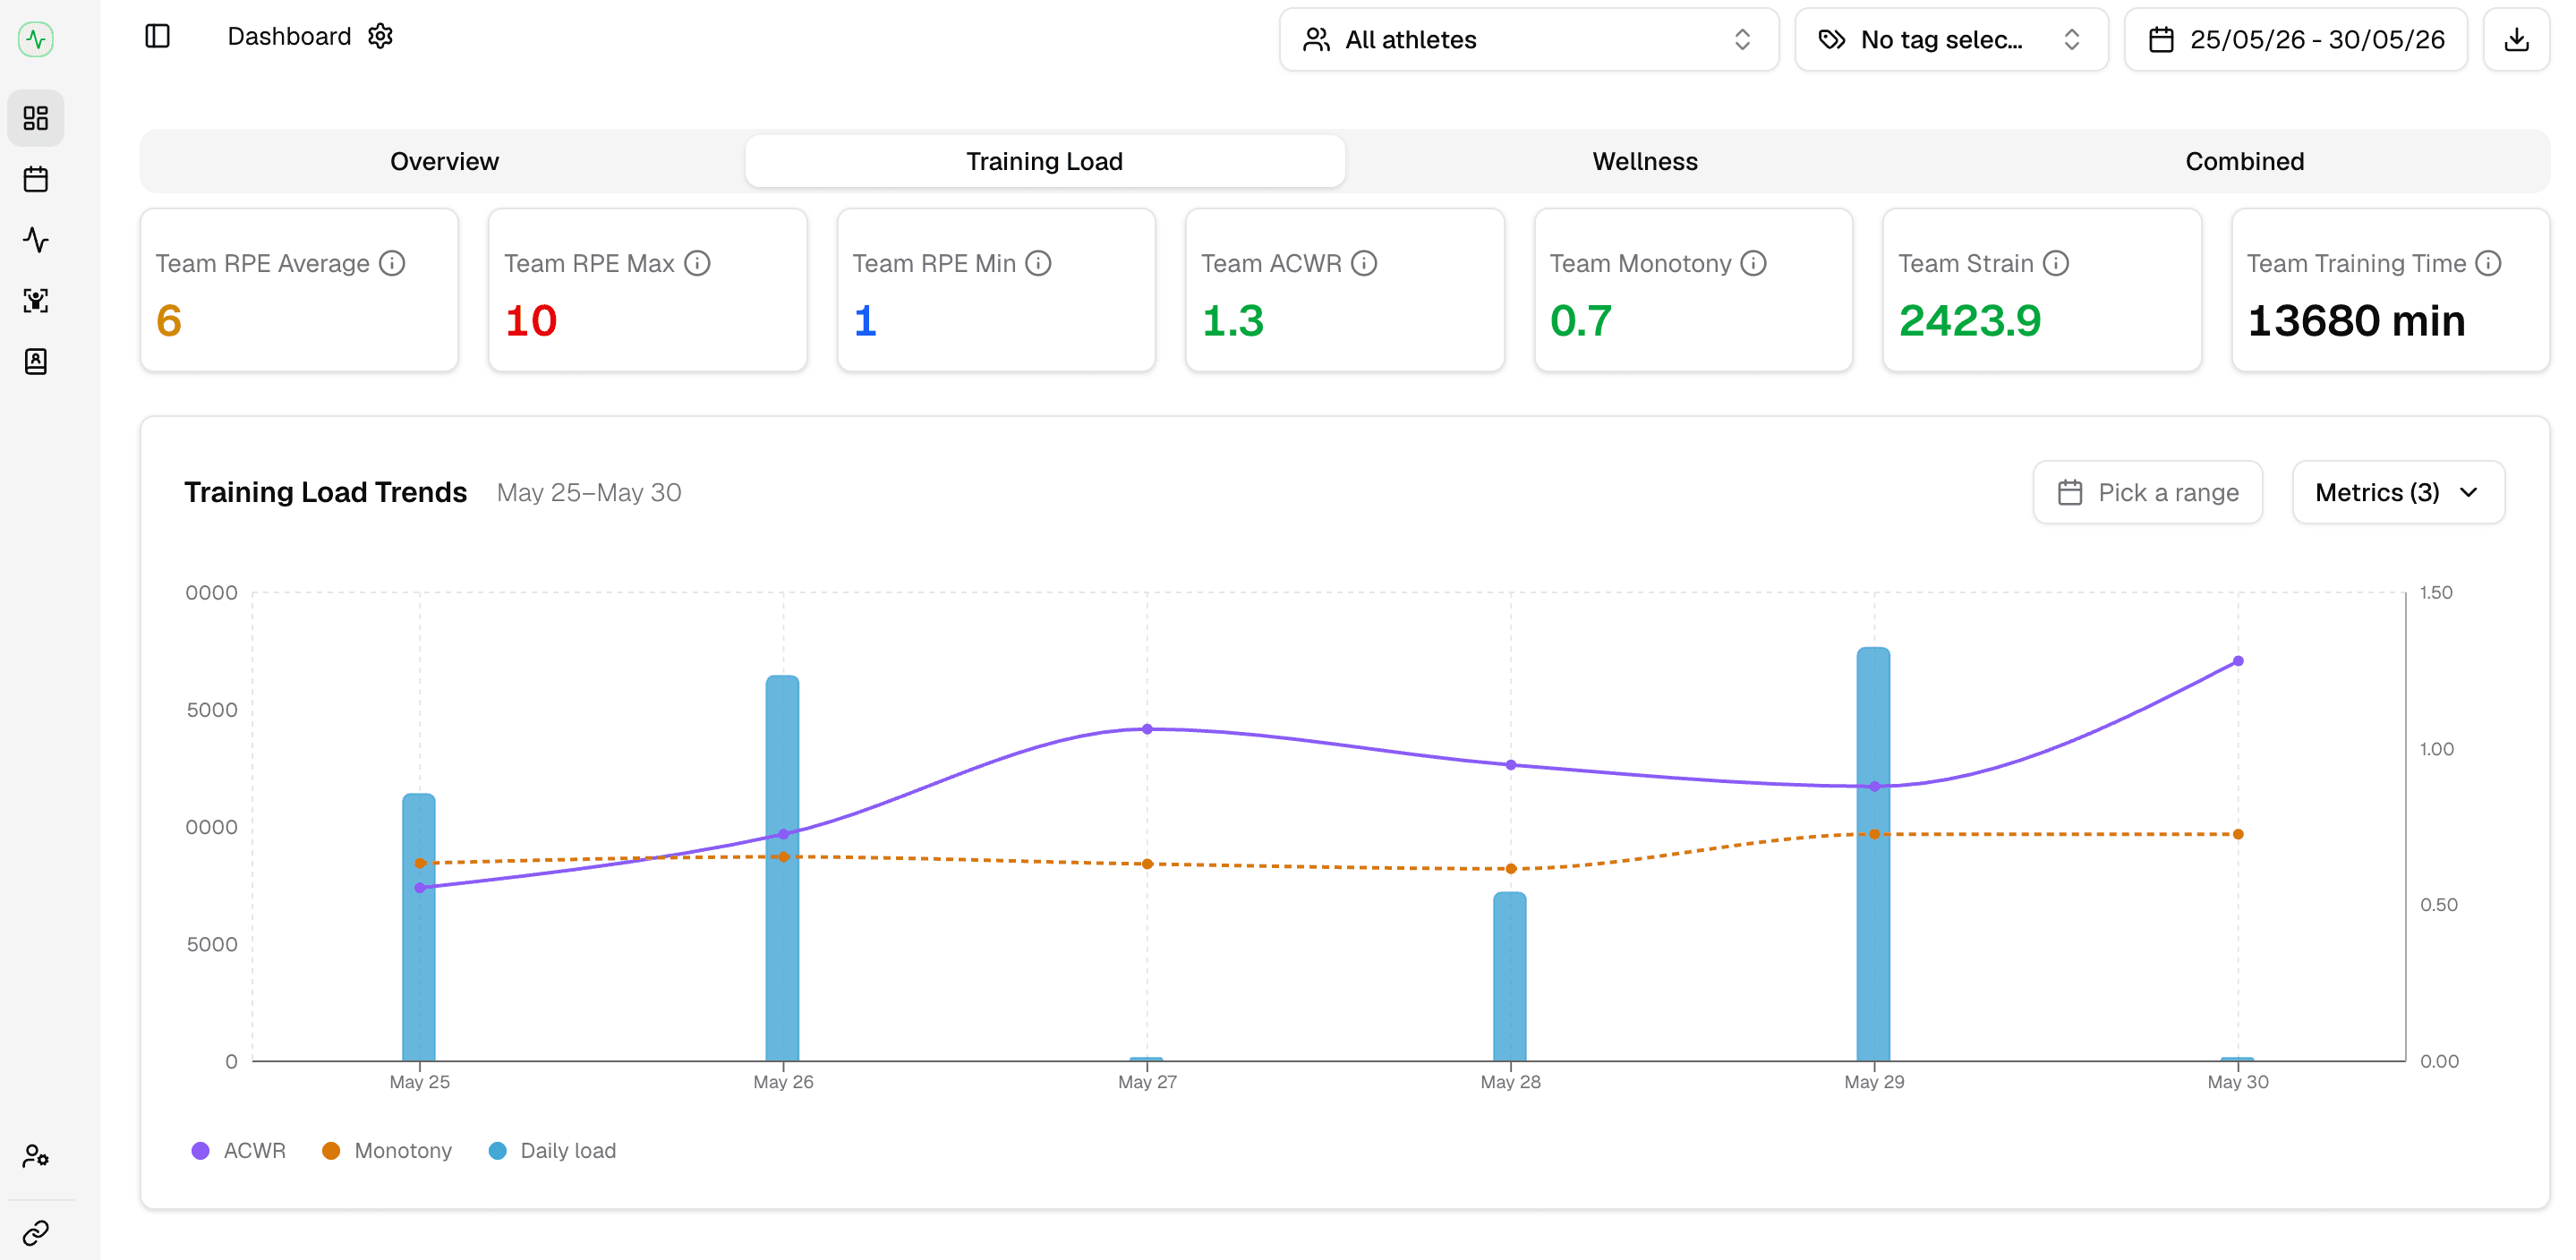
A simple internal-load estimate usually calculated as session duration multiplied by athlete sRPE.
Example: 75 minutes x RPE 6 = 450 arbitrary units.
Estimate weekly load
Change the inputs to see how quickly simple session plans create different weekly load totals.
Estimated weekly load
1800
| Signal | Best for | Common mistake |
|---|---|---|
| Wellness | Spotting fatigue, stress, soreness, and sleep changes. | Treating one bad day as a complete diagnosis. |
| sRPE | Understanding how hard the work felt internally. | Comparing athletes without context. |
| Pain notes | Starting an early conversation before issues escalate. | Waiting until pain becomes availability loss. |
A balanced survey captures enough context while staying realistic for athletes.
Workflow
Turn the page into a guided product story
Interactive guide content should help the reader move from concept to workflow without feeling like a static article.
1. Start with the summary
Show the highest-level team state before asking coaches to inspect individual athletes.
2. Expose the exception
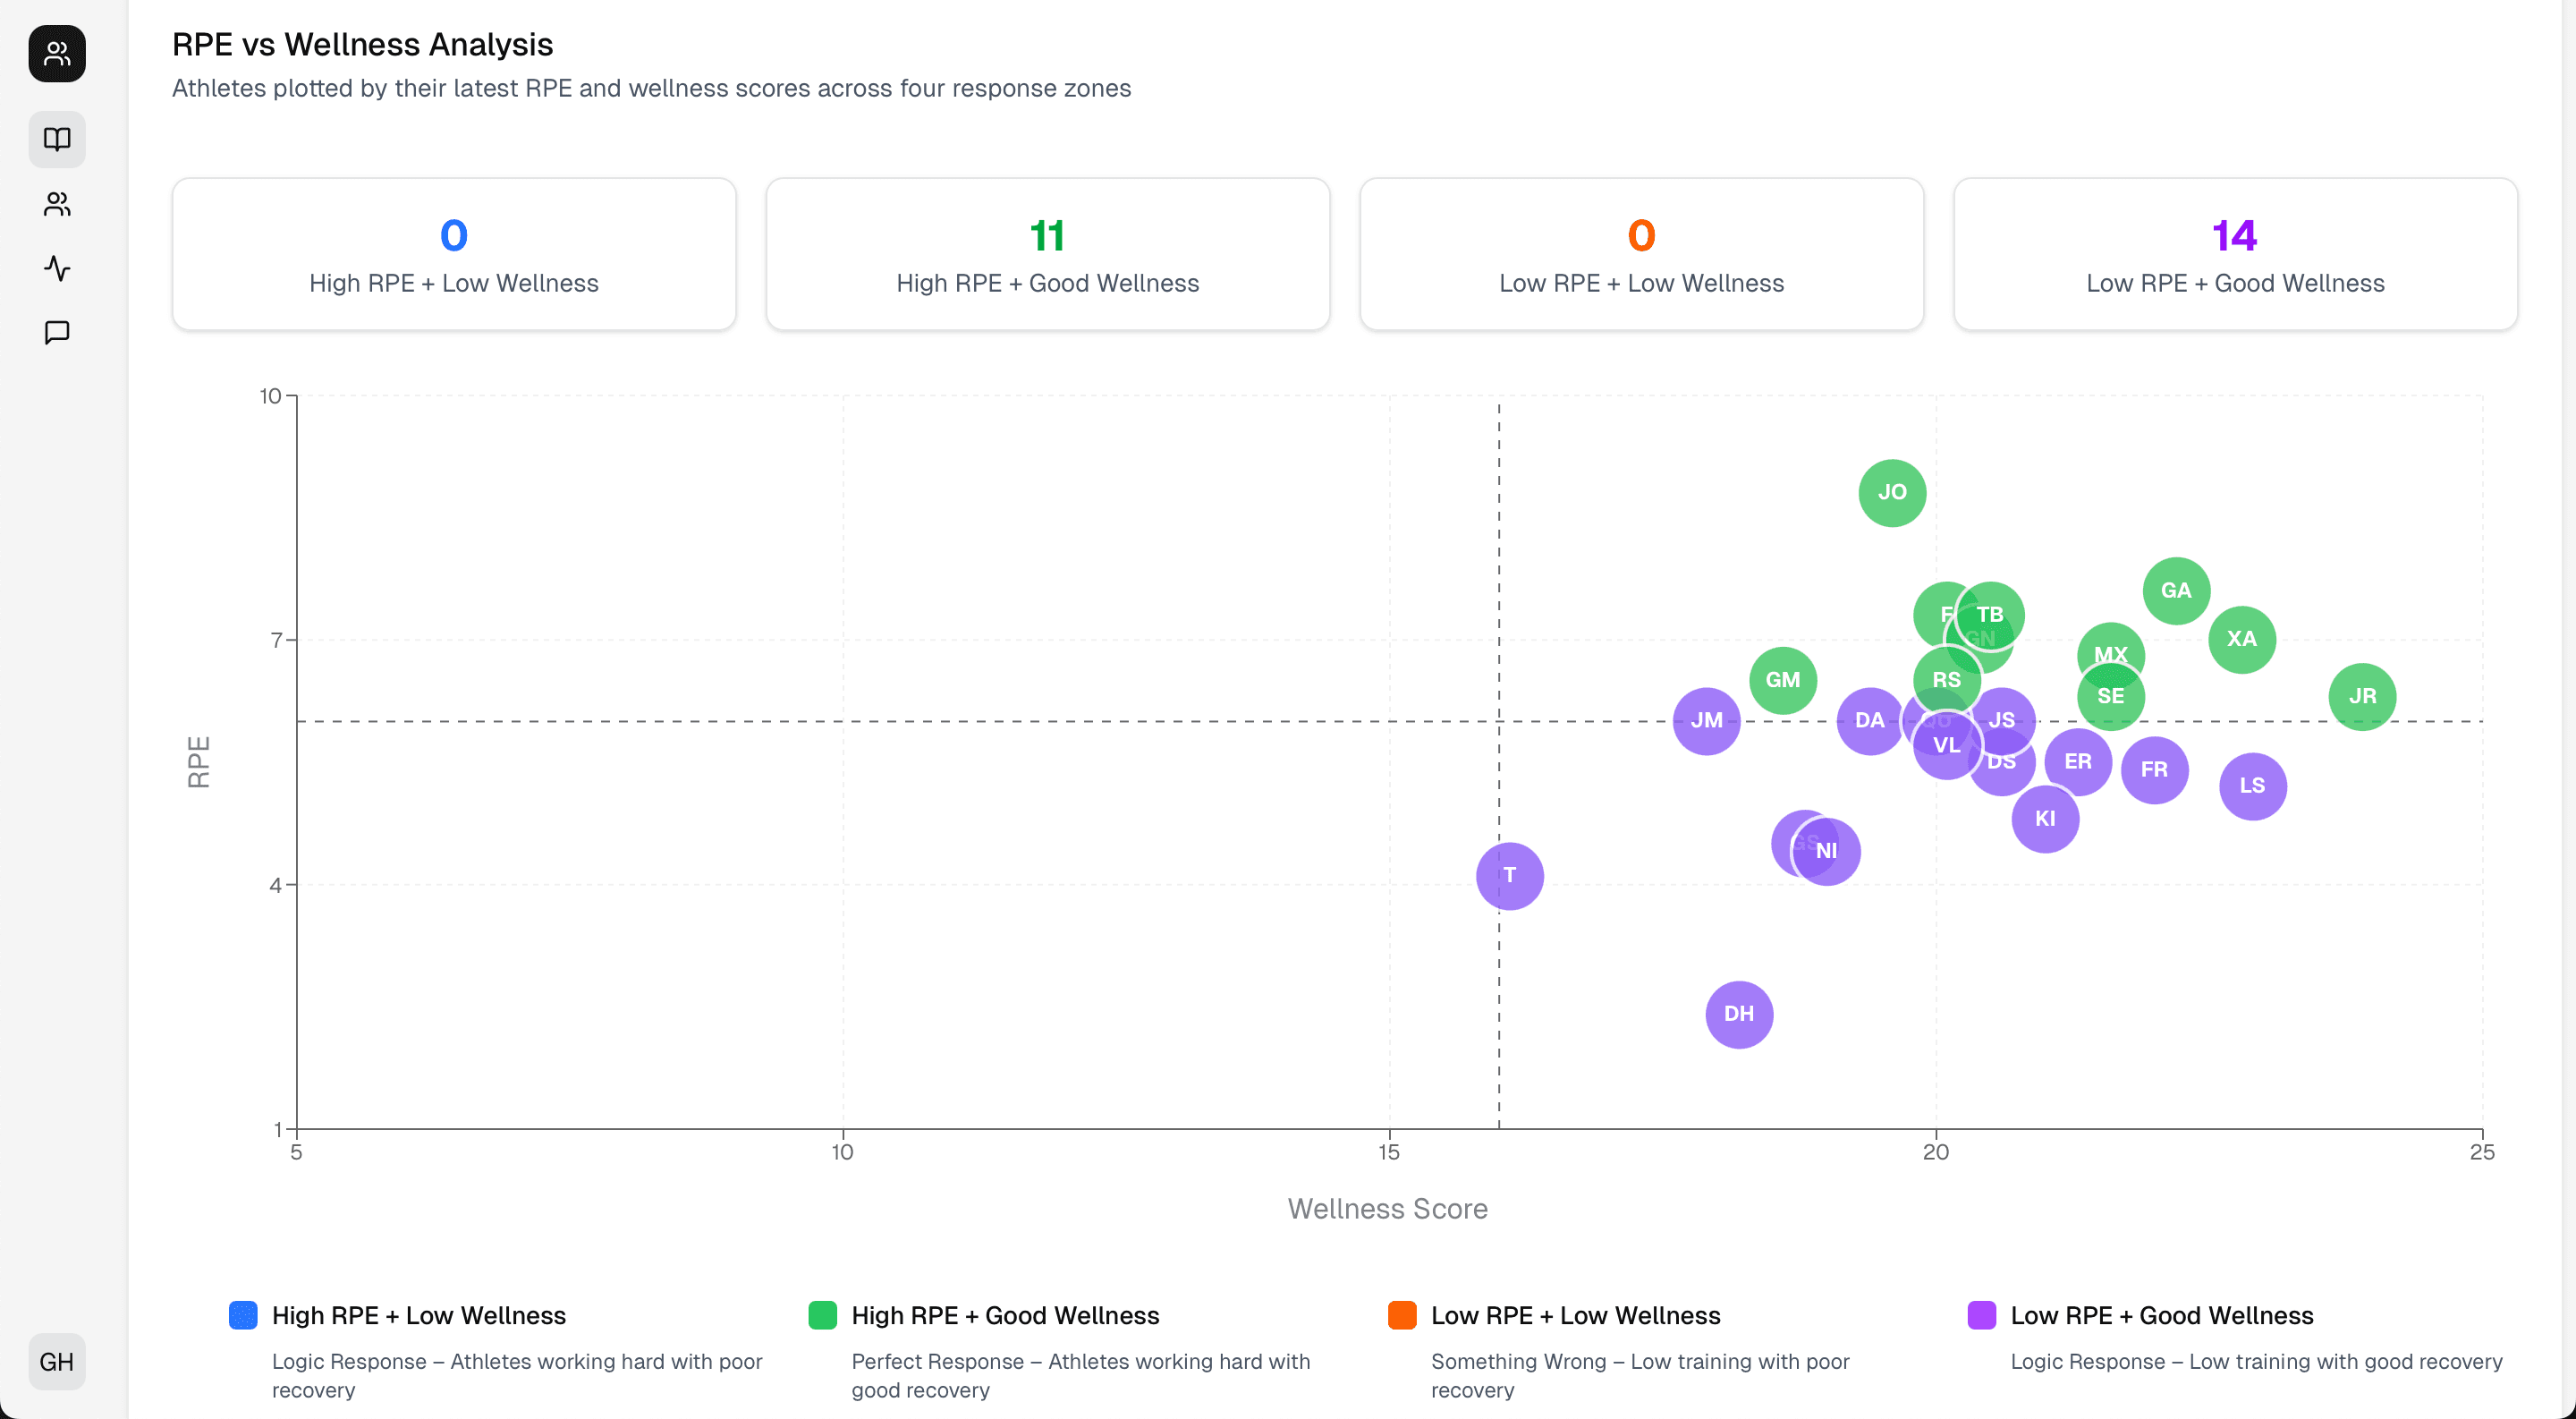
Highlight who changed, why it matters, and which signal triggered the flag.
3. Give the next action
A useful monitoring guide should end in a coaching decision, not a chart interpretation exercise.
Fast exception review
Check missing responses, pain changes, and severe wellness drops before training.
The reader consumes advice and has to imagine how it applies to their team.
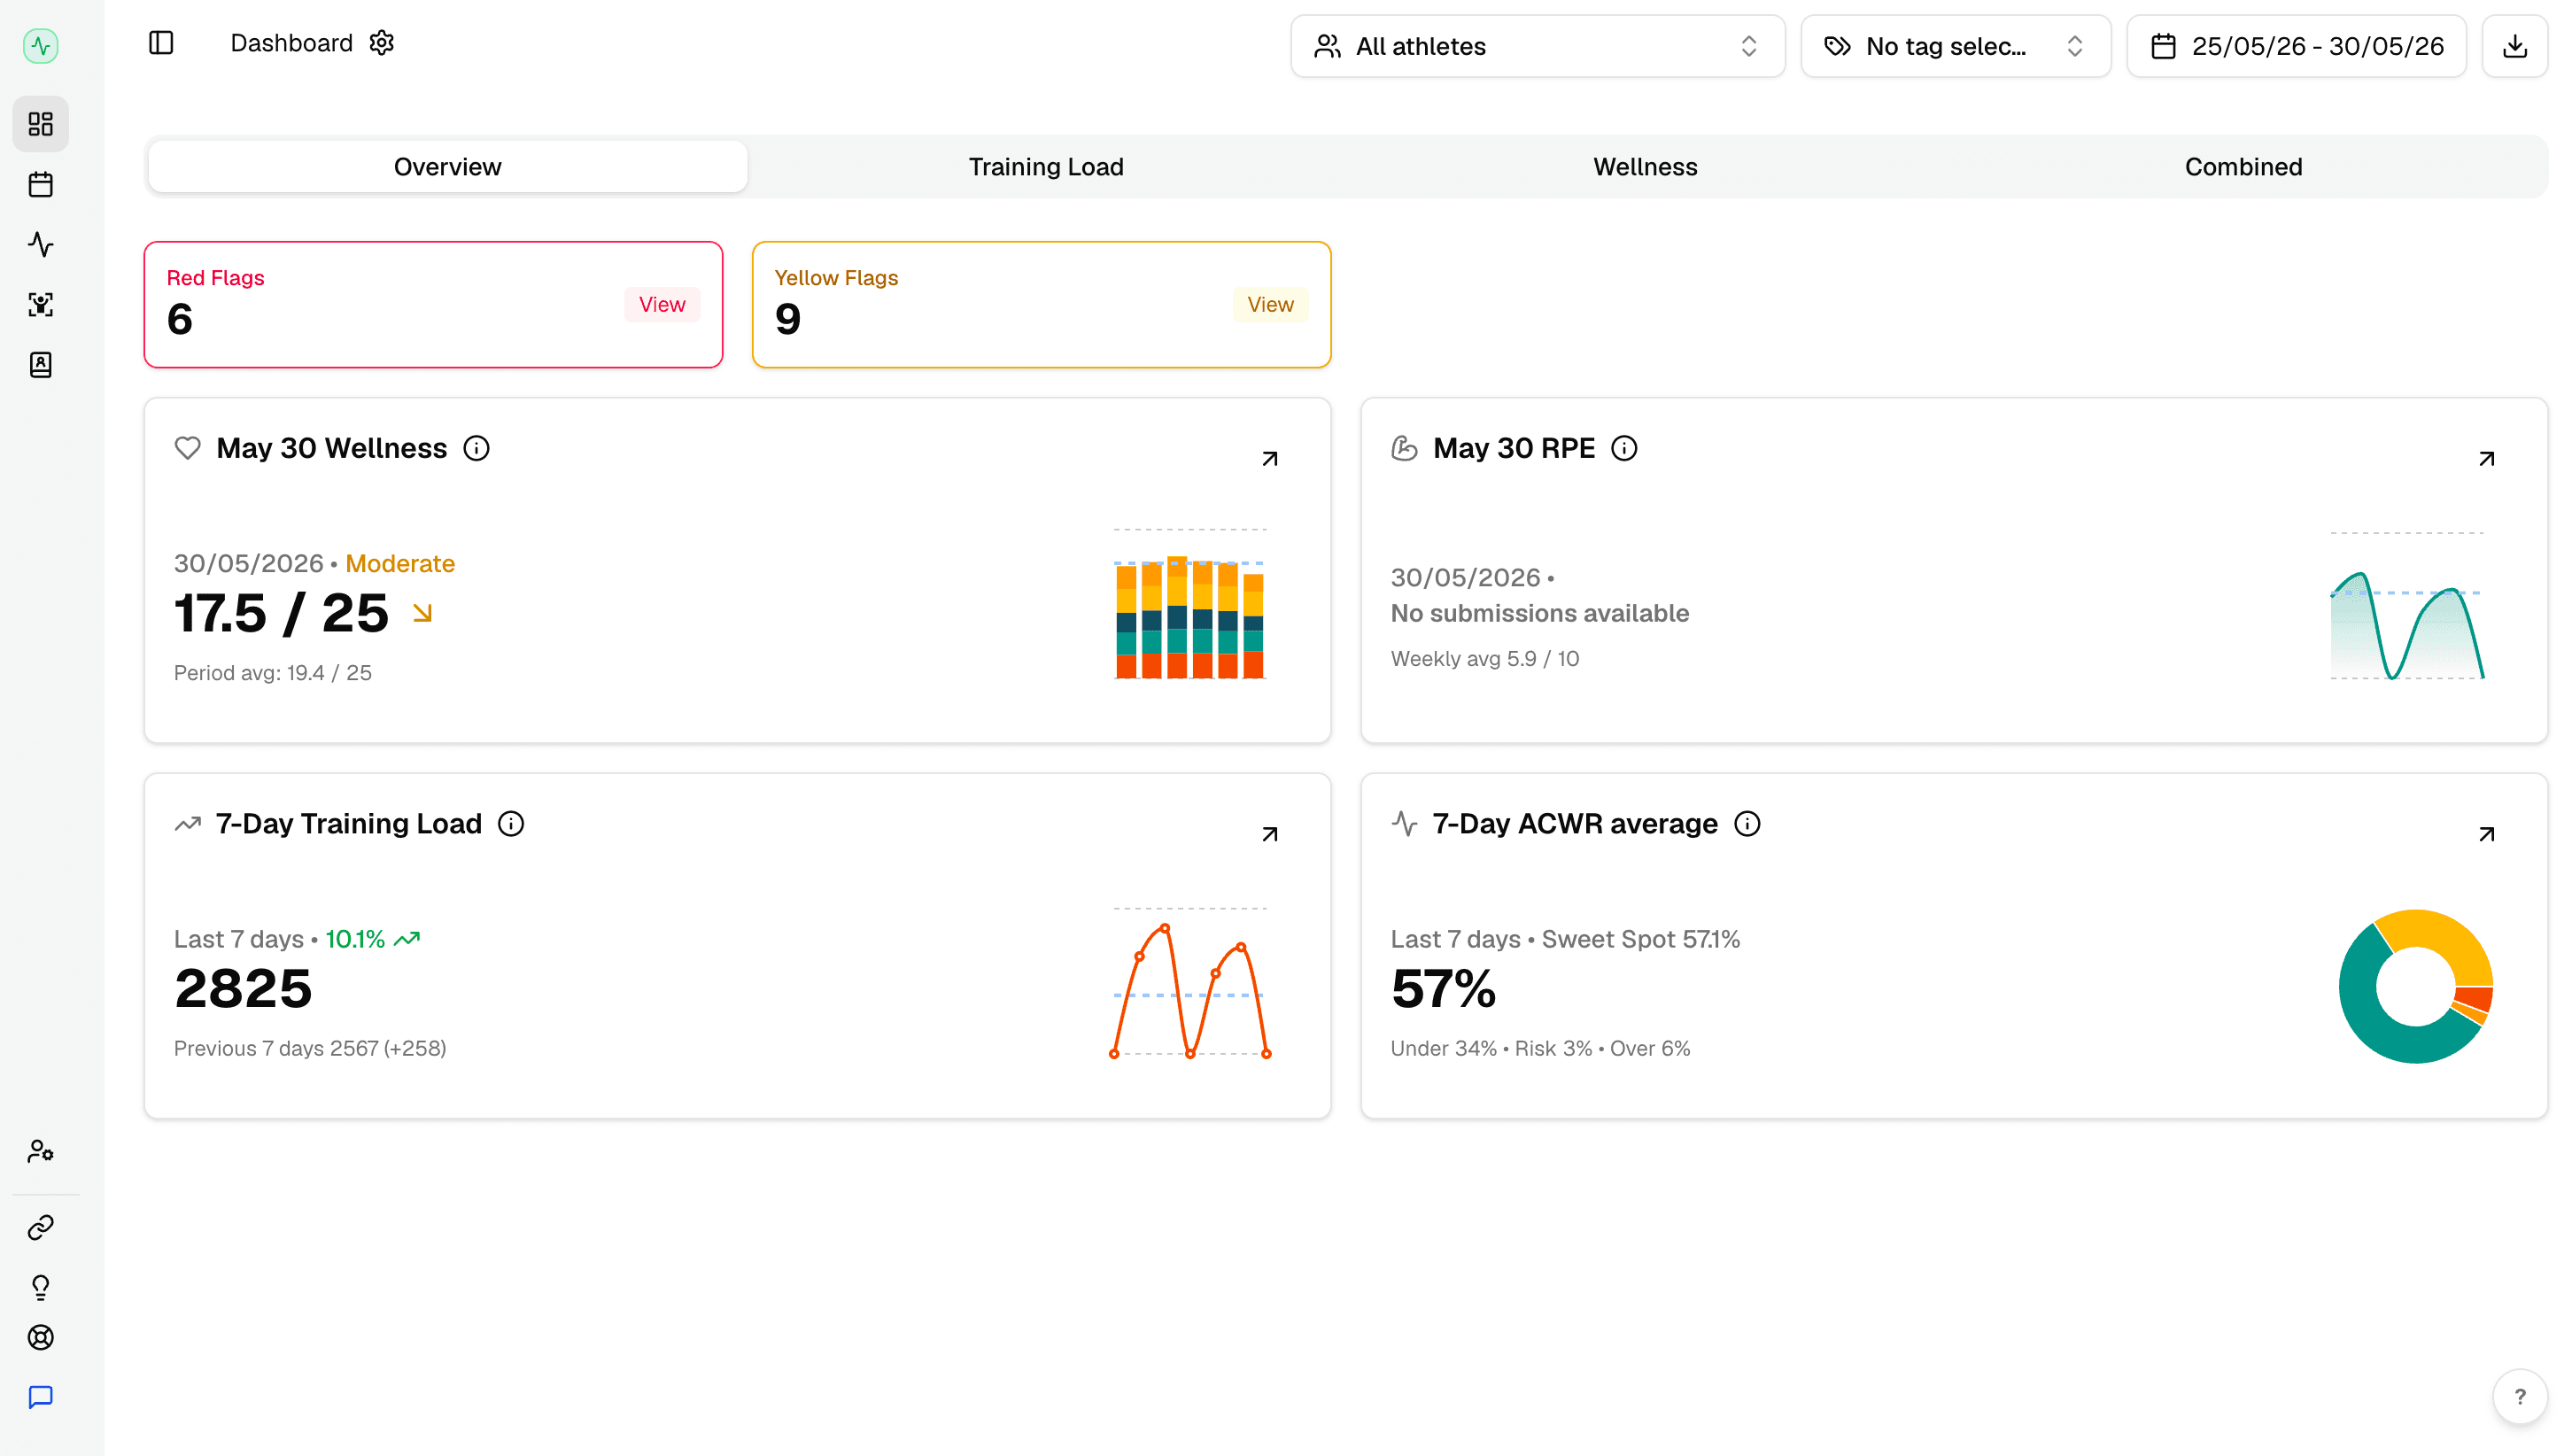
Example Fractall workflow
Collect wellness before the session and sRPE after the session.
Review flags from the dashboard before the next training decision.
Use weekly reports to align coaches, performance staff, and medical staff.
Publishing standard
Every guide needs a usefulness check
The agentic workflow should validate that each interactive element earns its place.
Works well for
- Explains one concrete decision or workflow.
- Uses visuals to clarify, not decorate.
- Keeps interaction lightweight and mobile-friendly.
Watch out for
- Invents a custom component for a one-off paragraph.
- Uses interaction where a table would be clearer.
- Adds claims without evidence or caveats.
1
Primary job per guide
Each guide should teach one workflow or decision model deeply.
3-6
Major sections
Enough structure for depth without becoming a microsite.
Before publishing
- Metadata, canonical URL, and social image are defined.
- Every image has useful alt text.
- Interactive blocks work without layout shift on mobile.
- Claims are sourced, qualified, or framed as product guidance.
Build monitoring workflows that coaches can repeat
Fractall helps teams collect wellness and sRPE data, detect load changes, and turn reports into practical staff decisions.
FAQs
Monitoring loop questions coaches ask
How many signals should we track?
How often should the loop run?
What makes a monitoring dashboard go unused?
Do we need to start with the whole squad?
Related guides
Two Games a Week: What Wellness Data Shows Before Match 2
Fractall data on football teams playing two games a week: on match morning, fatigue sits less than half as far above normal. How to read wellness between games.
ChatGPT and Claude for Strength and Conditioning Coaches
What an S&C coach can ask ChatGPT or Claude about squad load, wellness and injuries, and the privacy settings to change before any athlete data goes in.
CMJ Test: Protocol, Norms and Why Devices Disagree
The same countermovement jump reads nearly 7 cm apart on a force plate, a phone app and a sensor. Triple the U16 to U18 gap. The protocol and the norms.