Every decision, backed by data
The Fractall coach dashboard turns athlete check-ins into actionable intelligence — across four dashboard views, individual athlete profiles, and exportable PDF reports.
Your team's readiness, at a glance
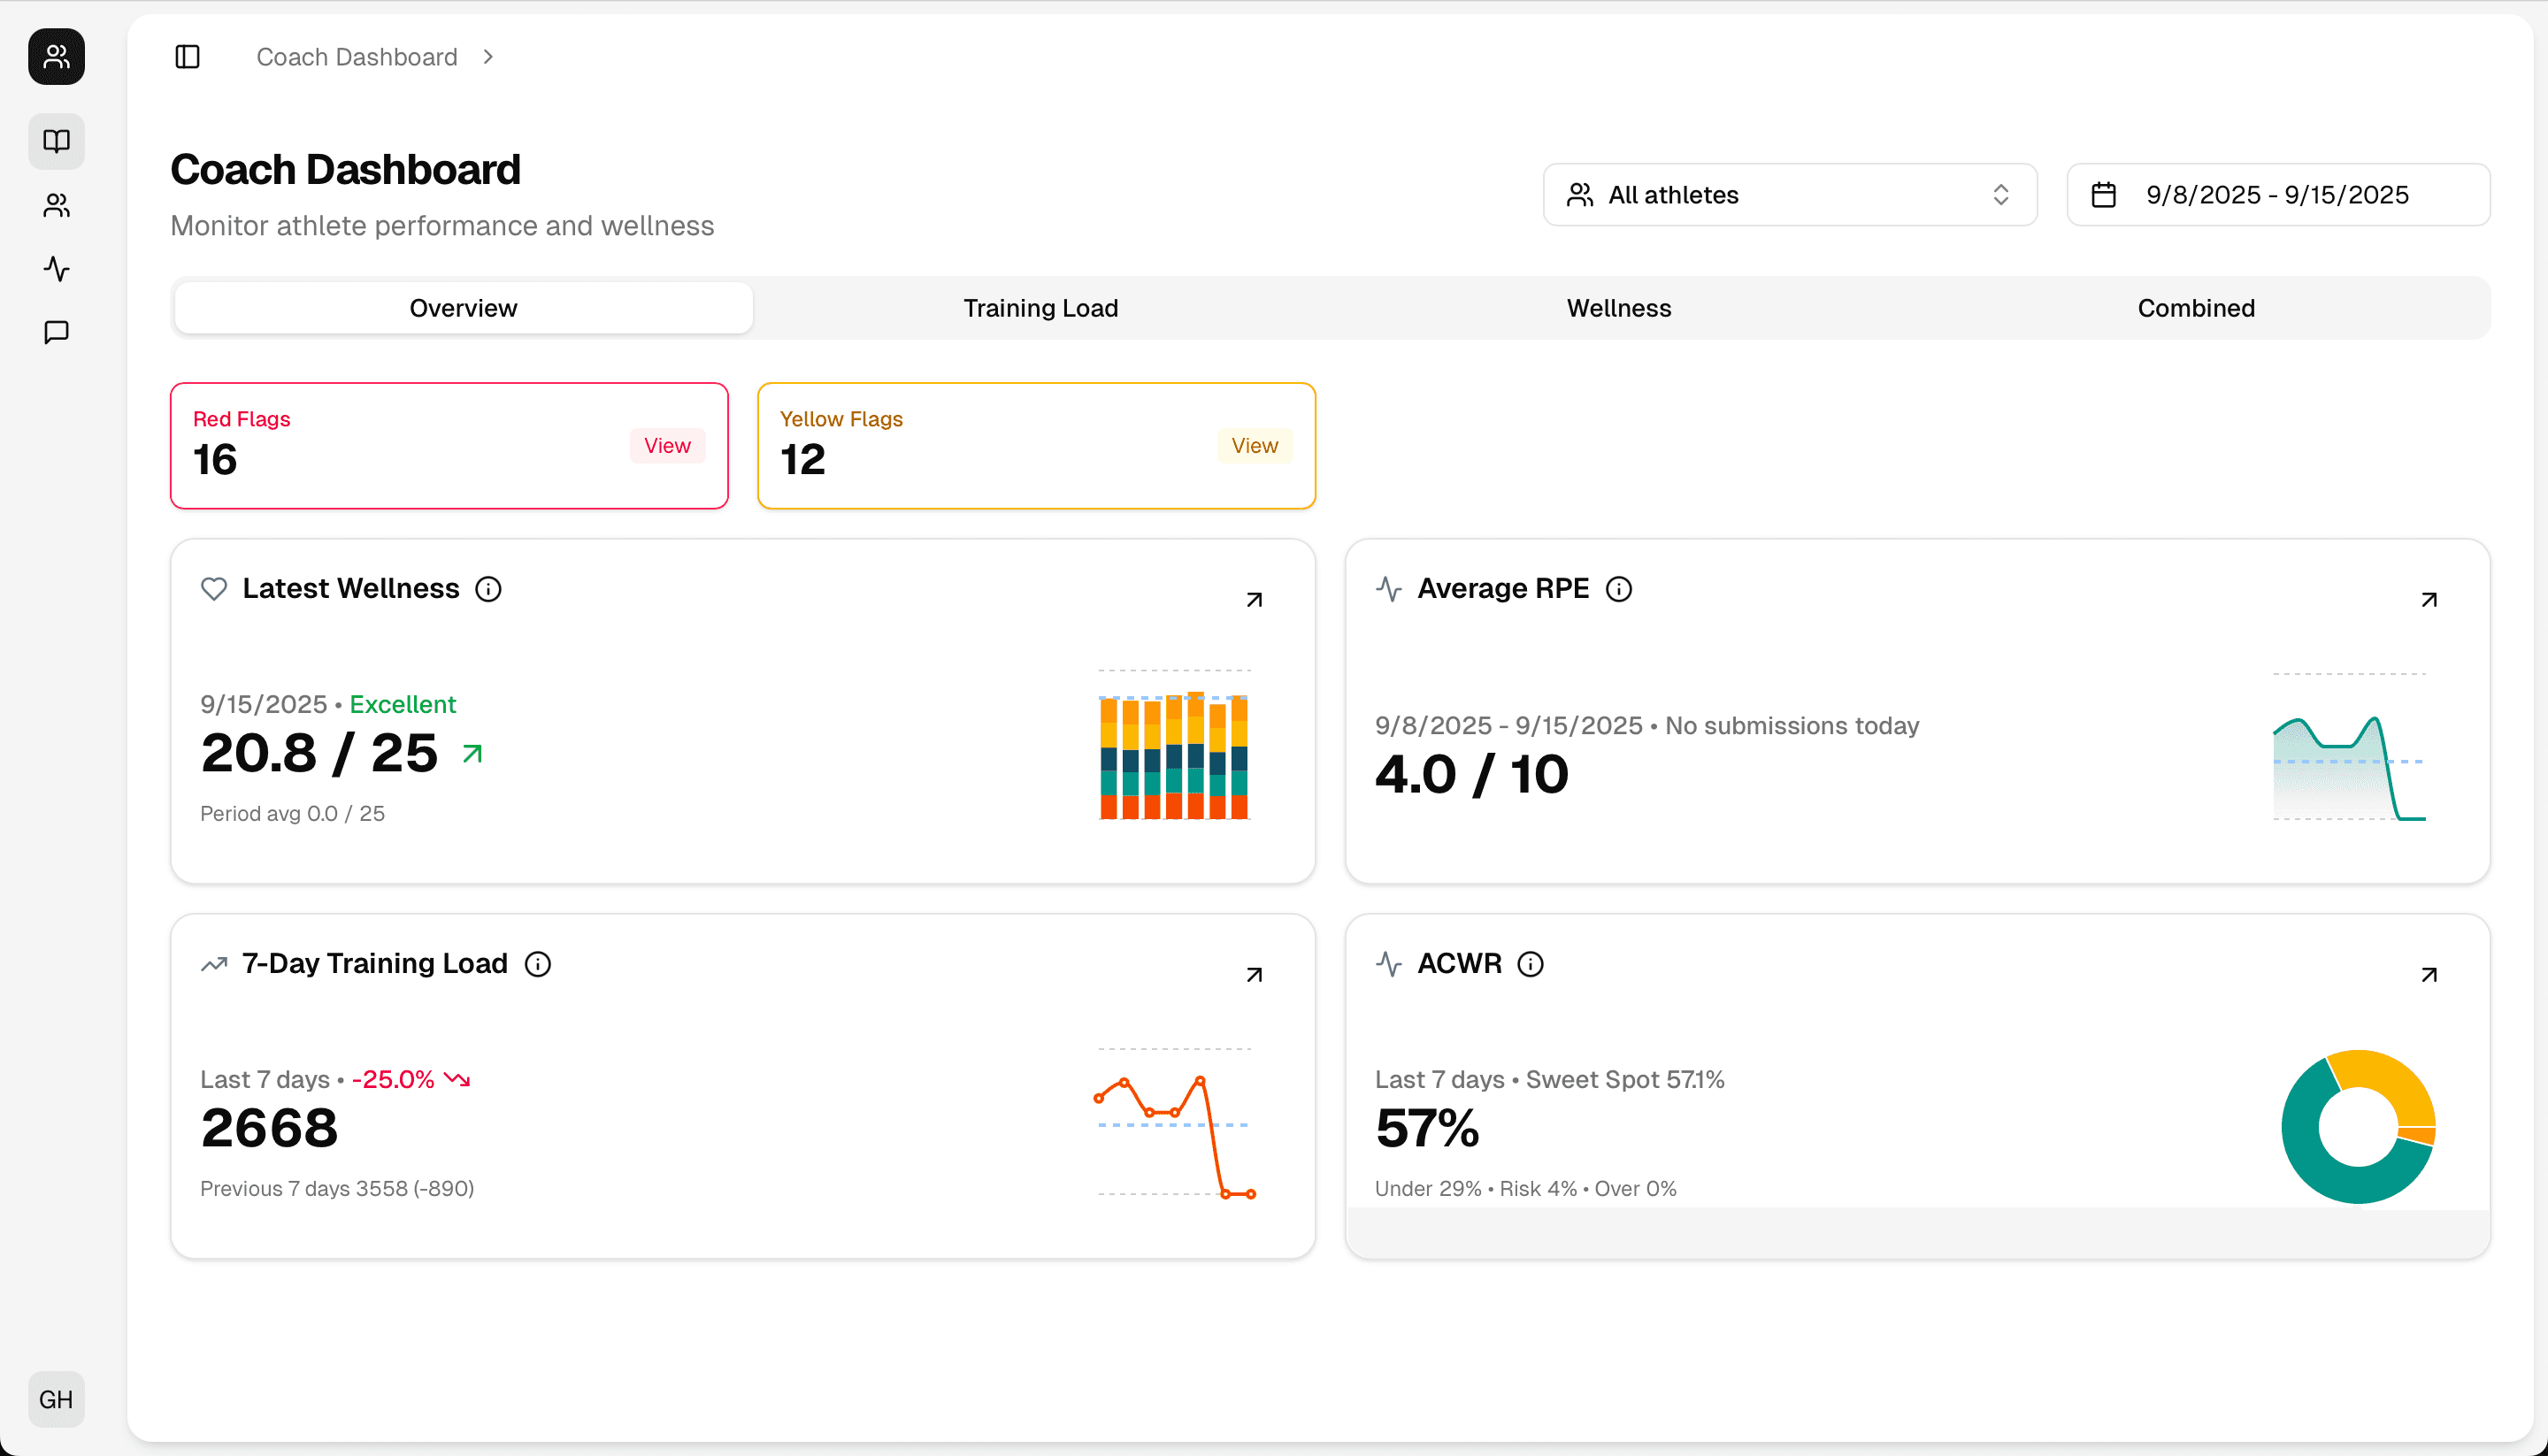
The Overview tab is the first thing coaches see when they open the dashboard. It surfaces the athletes who need attention — red and yellow flags generated automatically from ACWR thresholds, wellness scores, and submission history — alongside four KPI cards covering wellness, RPE, weekly load, and ACWR status. No digging, no manual calculation.
Automated red & yellow flags
Fractall evaluates each athlete against configurable ACWR thresholds and wellness score baselines. Athletes outside the safe zone are automatically surfaced as red (high risk) or yellow (caution) flags.
Team wellness KPI
Aggregated wellness score across the selected athletes and date range, with a mini sparkline to show the trend direction — up, down, or stable.
Average RPE
Team-level average RPE for the selected period. Colour-coded by effort zone: green (light), amber (moderate), orange (vigorous), red (max).
Weekly load & ACWR status
Total training load for the week alongside the team ACWR — the ratio that predicts injury risk. Coaches can see at a glance whether the team is in the optimal 0.8–1.3 range or edging into the danger zone.
Filters: athletes, date range, training tags
All dashboard views share a global filter bar. Coaches can scope data to a specific athlete, a custom date window, or a training tag (e.g. match, conditioning, strength).
Want the full picture?
Explore dedicated pages for the core features powering the dashboard.
RPE & Training Load Monitoring
How Fractall tracks internal load, calculates ACWR, and flags overloaded athletes — no GPS required.
Learn more ->Athlete Wellness Tracking
How Fractall collects daily wellness check-ins and turns them into squad readiness intelligence.
Learn more ->ACWR Dashboard
How Fractall calculates the Acute:Chronic Workload Ratio and uses it to flag injury risk before it becomes an injury.
Learn more ->See it with your team's data
Start your 4-week free trial. Your dashboard is live in under 10 minutes.