1 Month Free Access (cancel anytime)

The combined view plots every athlete with their wellness score on one axis and their RPE on the other, split into four zones by reference lines at a wellness score of 16 and an RPE of 6. Where an athlete lands says more than either number reads on its own.
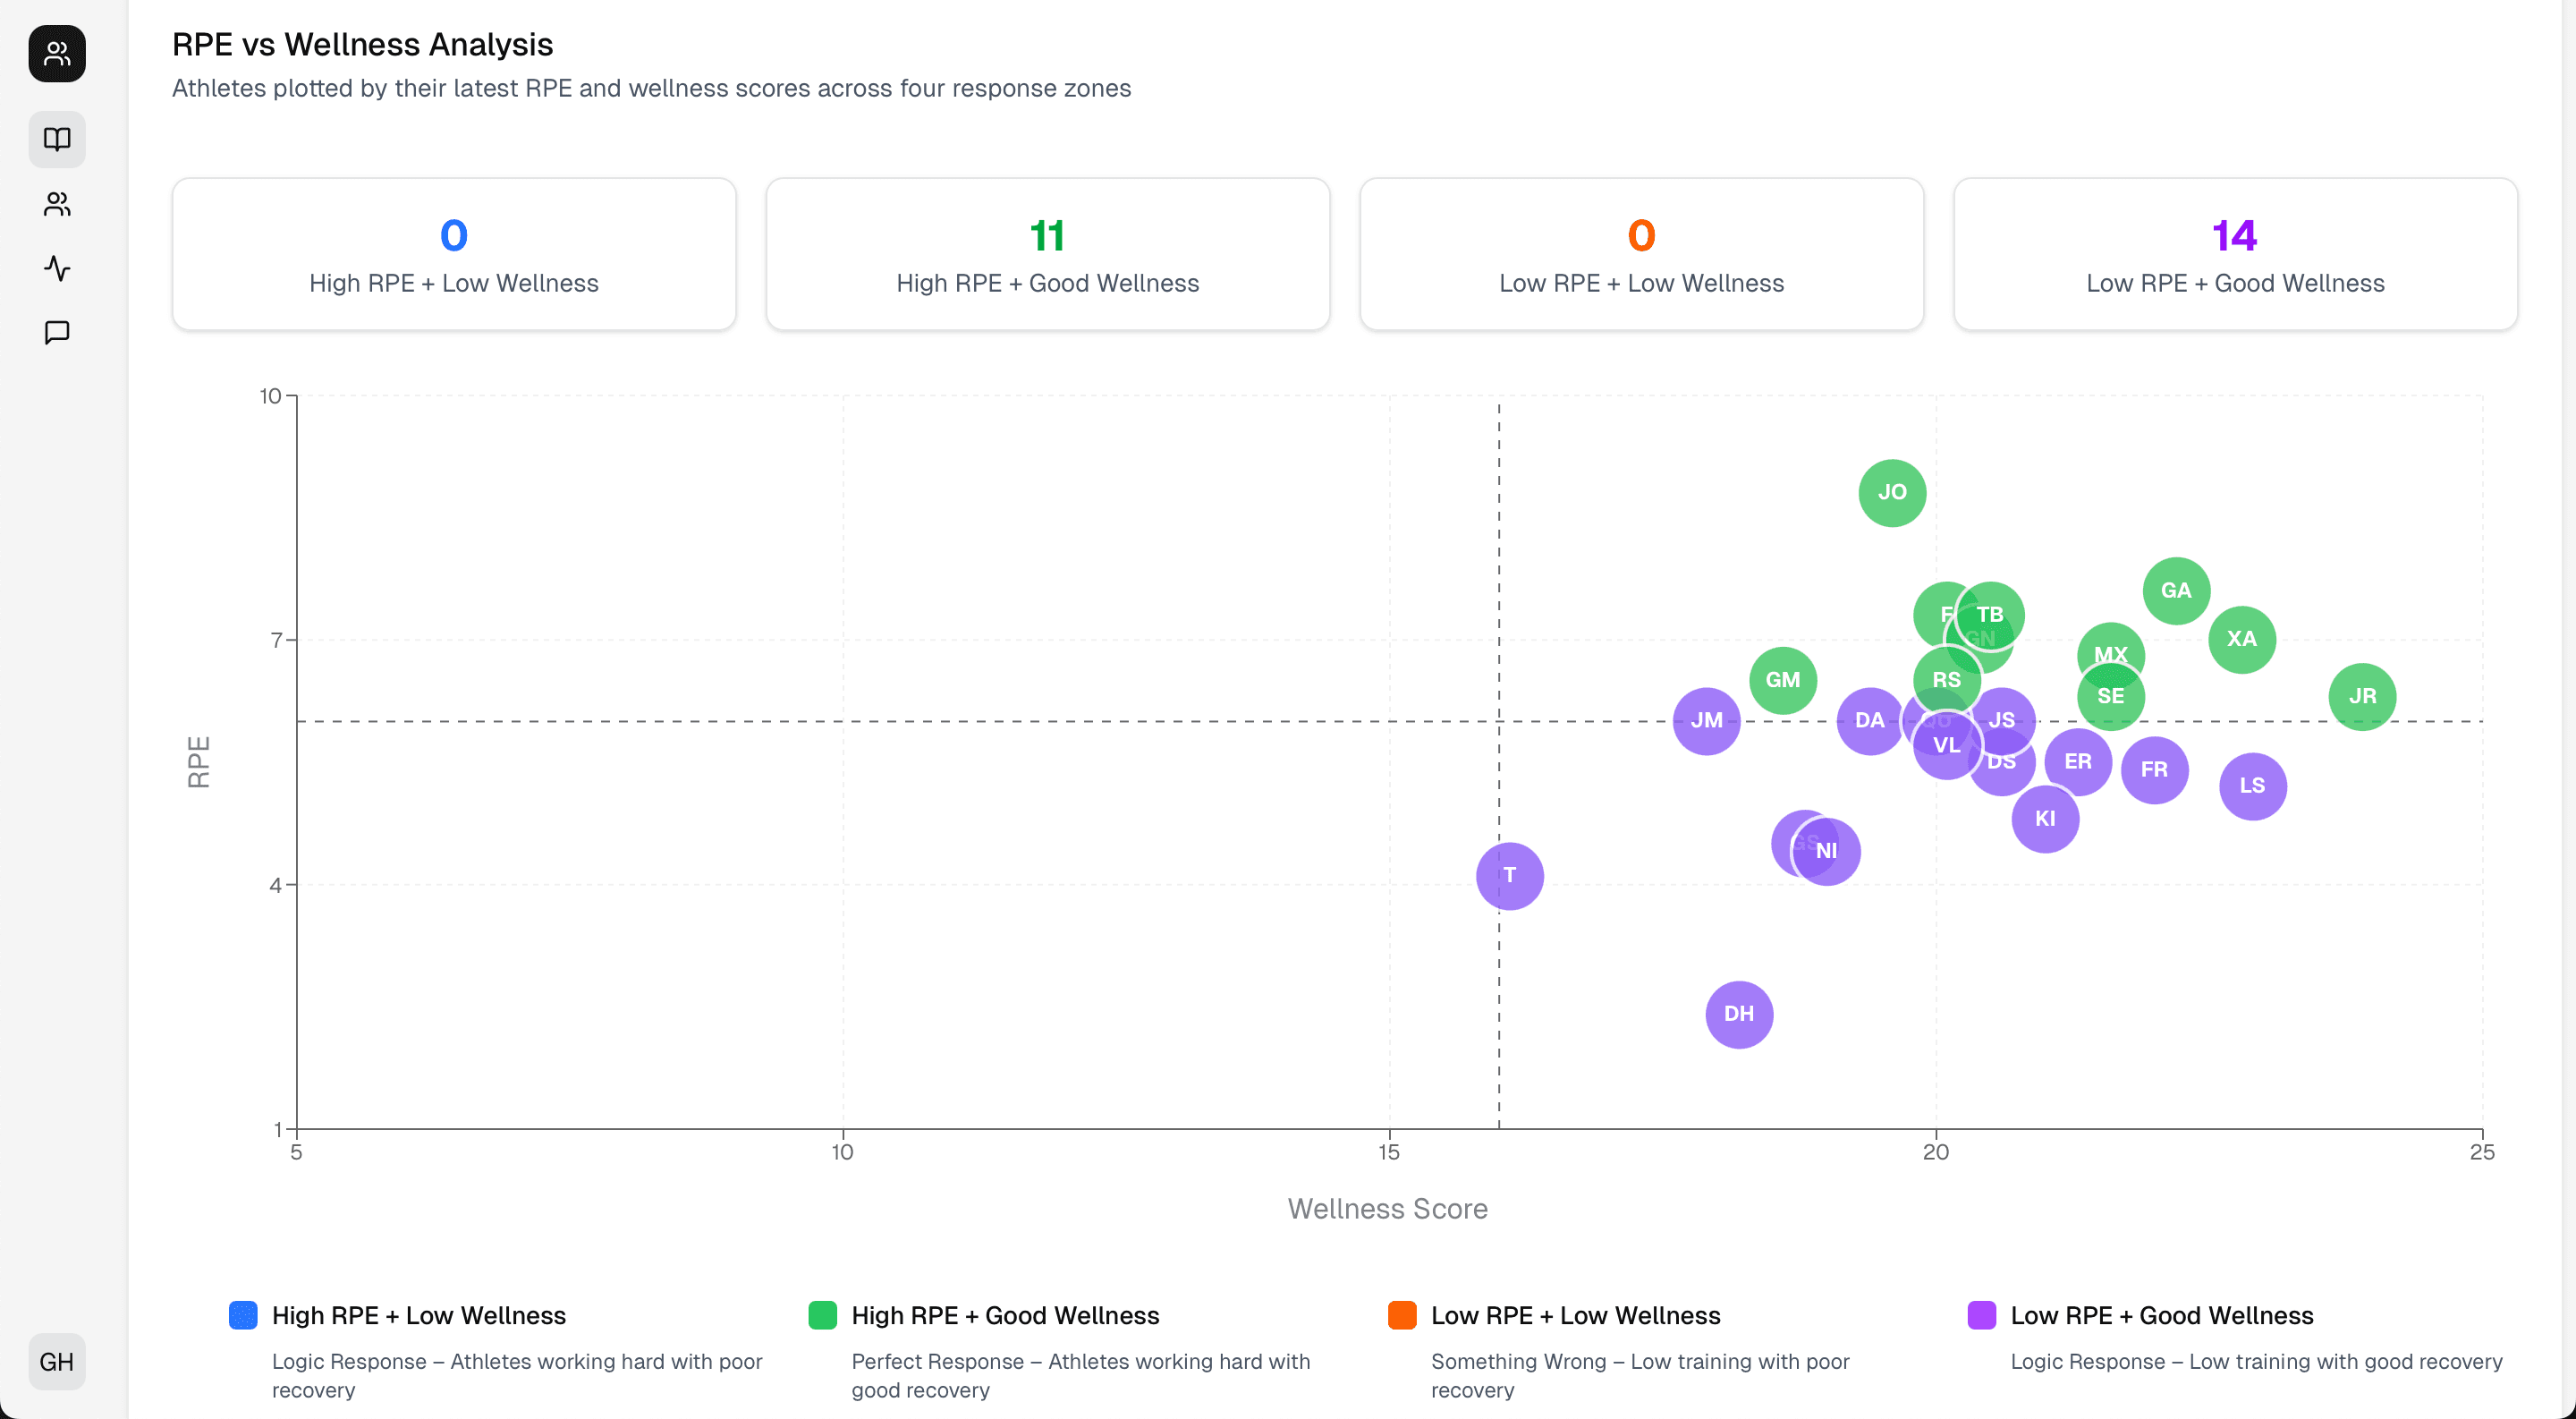
Each dot is one athlete's latest RPE and wellness score on the date you've selected, so you're reading today's squad rather than a monthly average. High effort with good wellness reads as a healthy response to the block. Low effort with low wellness is the corner worth acting on, and Fractall labels it in the product rather than leaving you to work out which quadrant is which.
Reference lines
A wellness score of 16 and an RPE of 6 divide the chart into four.
Athlete level dots
Every athlete's latest pair of numbers on the date you've selected.
Named zones
All four response zones carry a label in the product.
Same filters
Athletes, dates and training tags carry across from the rest of the dashboard.
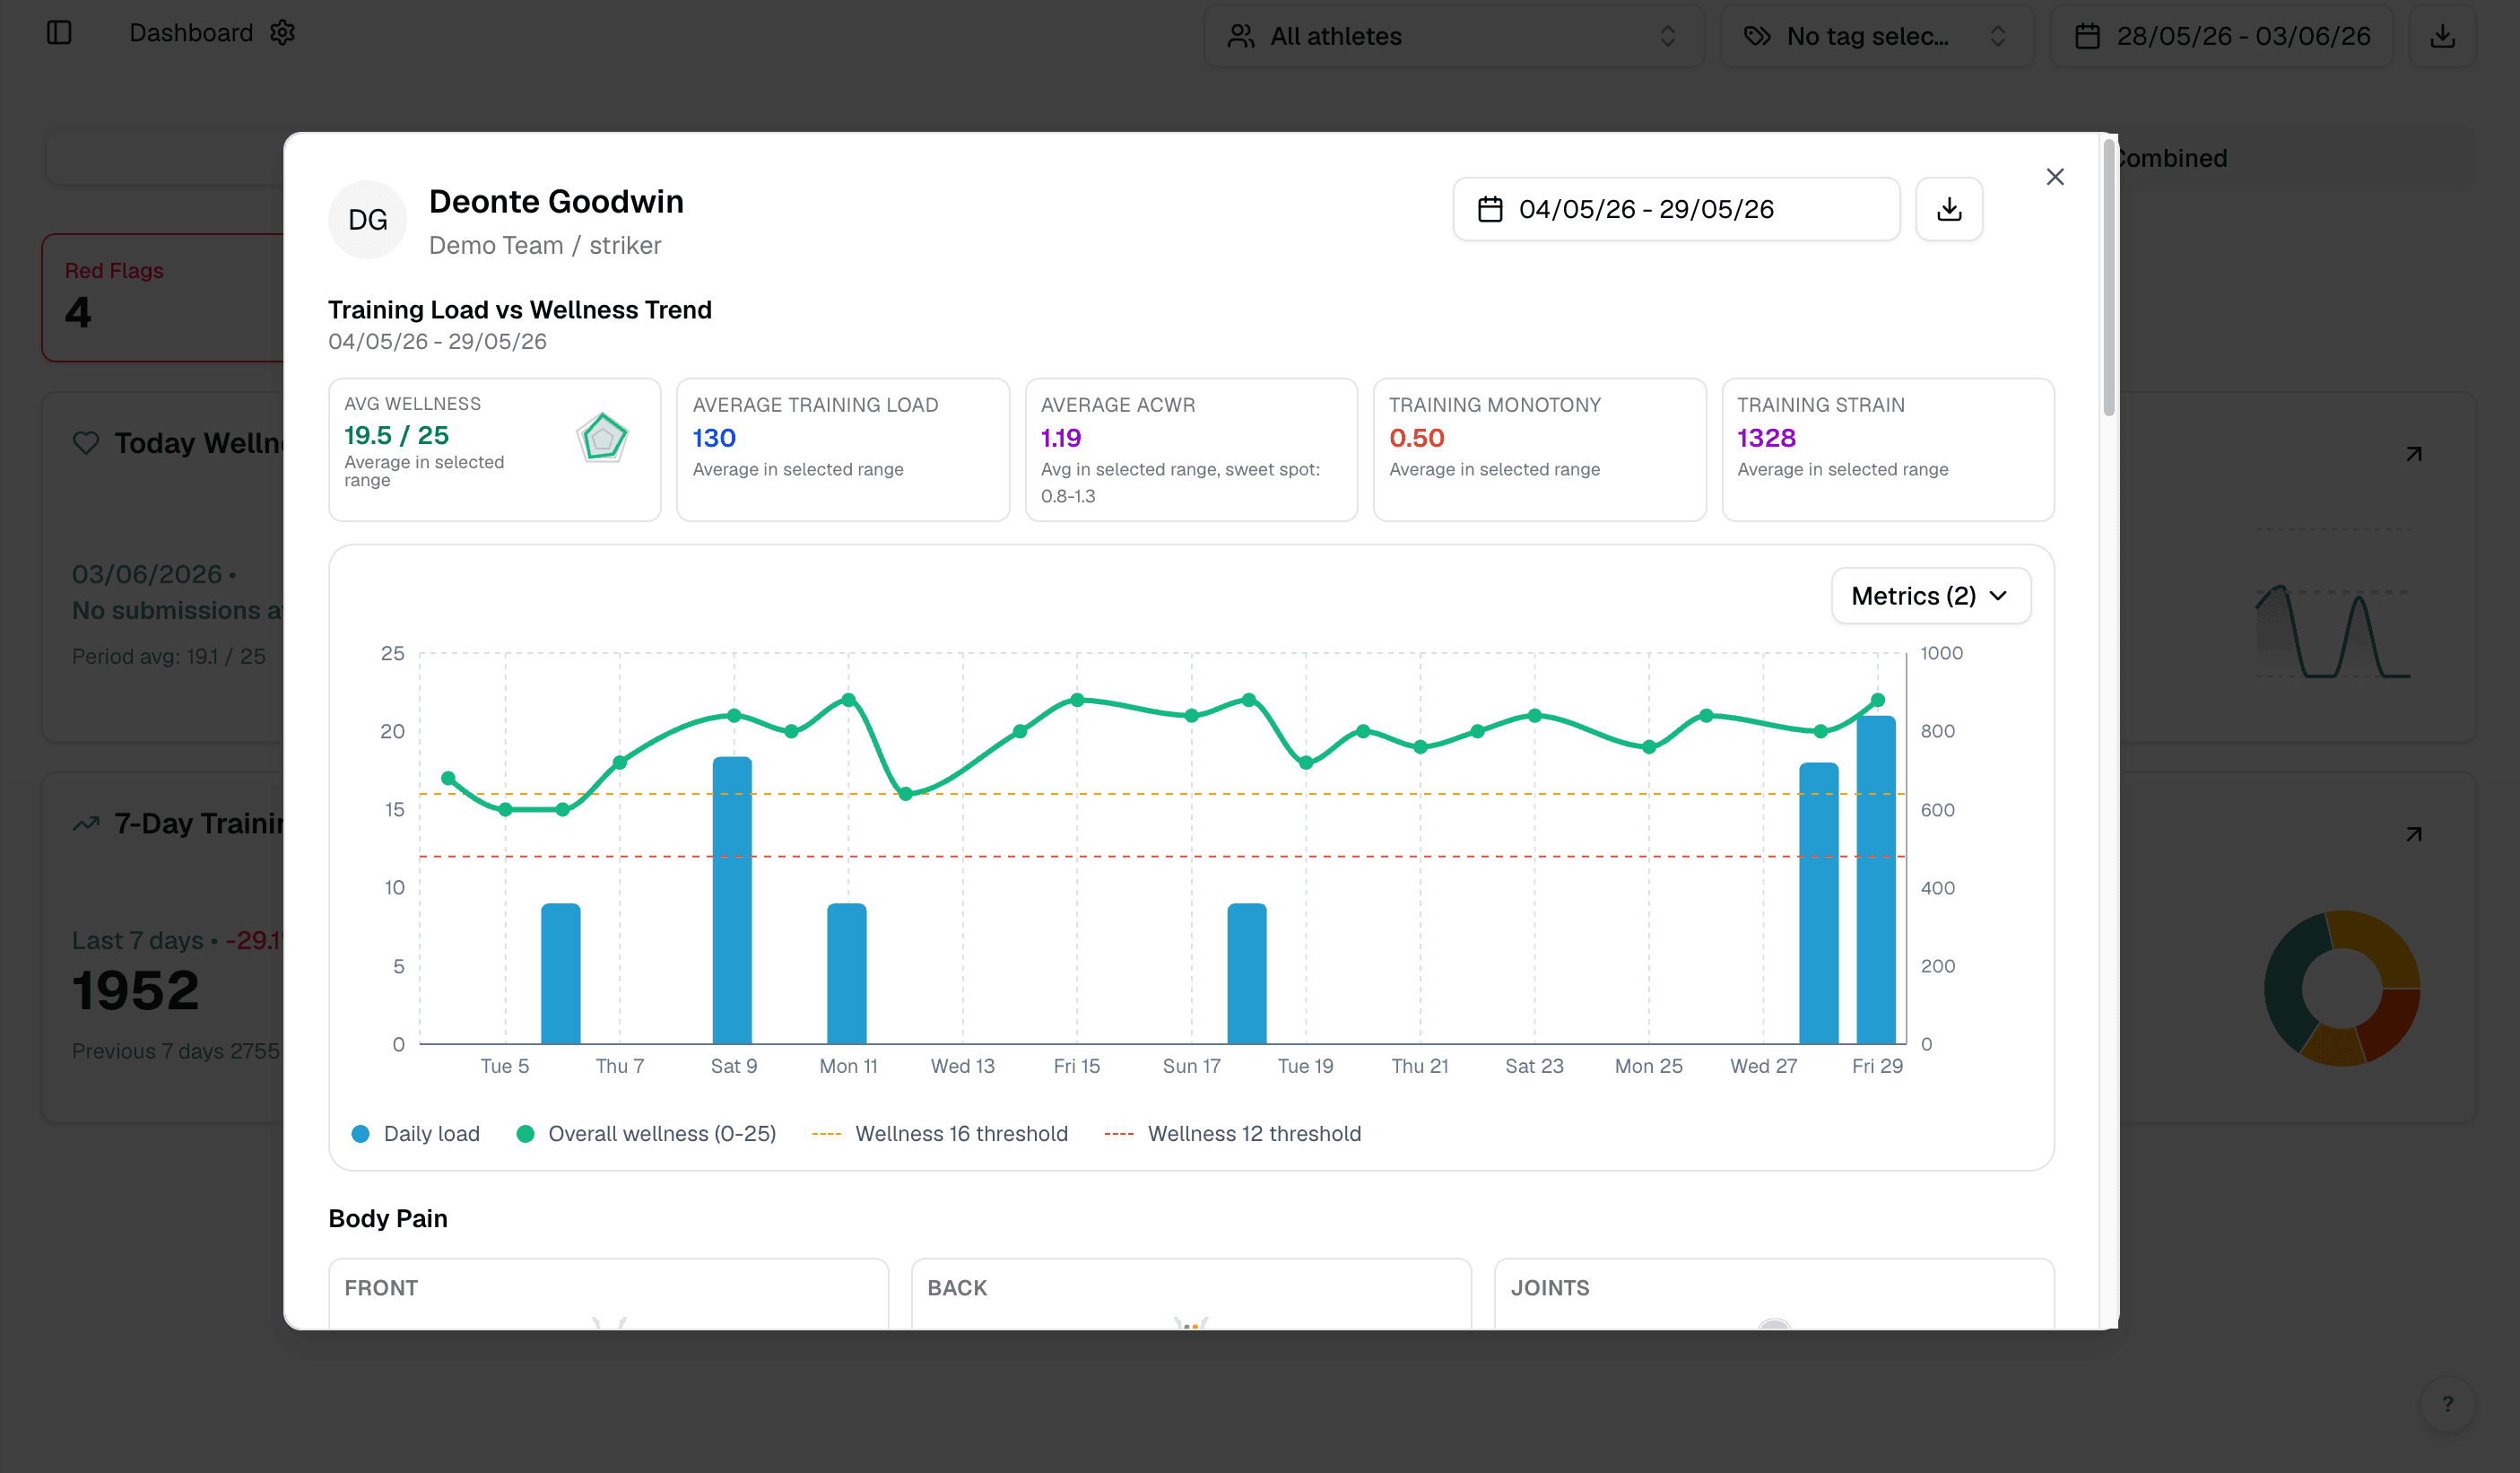
Click an athlete's name on the dashboard and their profile opens in three tabs: Wellness & Load, GPS and Injury Monitoring. Wellness & Load puts one athlete's load and wellness side by side: load and strain trends, ACWR on the date you're reading, all five wellness metrics, body pain reports, and cycle context where they log it. GPS adds their microcycle volume and every team session, newest first. Injury Monitoring lists current and previous injuries. An Injured or RTP badge marks anyone with an open injury. Open it when a head coach asks why you pulled someone from a session.
Load and wellness together
Both trend series in one place, for one athlete, over the same window.
ACWR at date
Their ratio on the day you're reading, measured against your thresholds.
Cycle context
Sits next to the wellness dip it helps explain, for athletes who log it.
GPS tab
Microcycle volume and a session breakdown, compared against the benchmark you pick.
Injury Monitoring tab
Current and previous injuries with area, diagnosis, status and days out.
Shareable
The Wellness & Load tab exports as an athlete report.
Most clubs collect both and read them in different tabs on different days. A 1.4 ACWR means one thing when sleep and soreness are holding steady, and something else when they've been sliding for a week. On one chart you get both at a glance, instead of holding one number in your head while you go looking for the other.
One filter set
Change the date once and both series follow it.
Flags on both
ACWR and strain thresholds, plus wellness bands on the 5 to 25 score.
Traceable
Every flag comes back to a number and a threshold you set yourself.
Start a free trial and have your athletes submitting inside a week. There's no hardware to buy and no setup fee.
