1 Month Free Access (cancel anytime)

Every sRPE submission becomes session load, and from there weekly load, acute:chronic workload ratio, monotony and strain. Calculated per athlete across whatever date range and athlete filter you've set. One number from each athlete after each session does all of it.
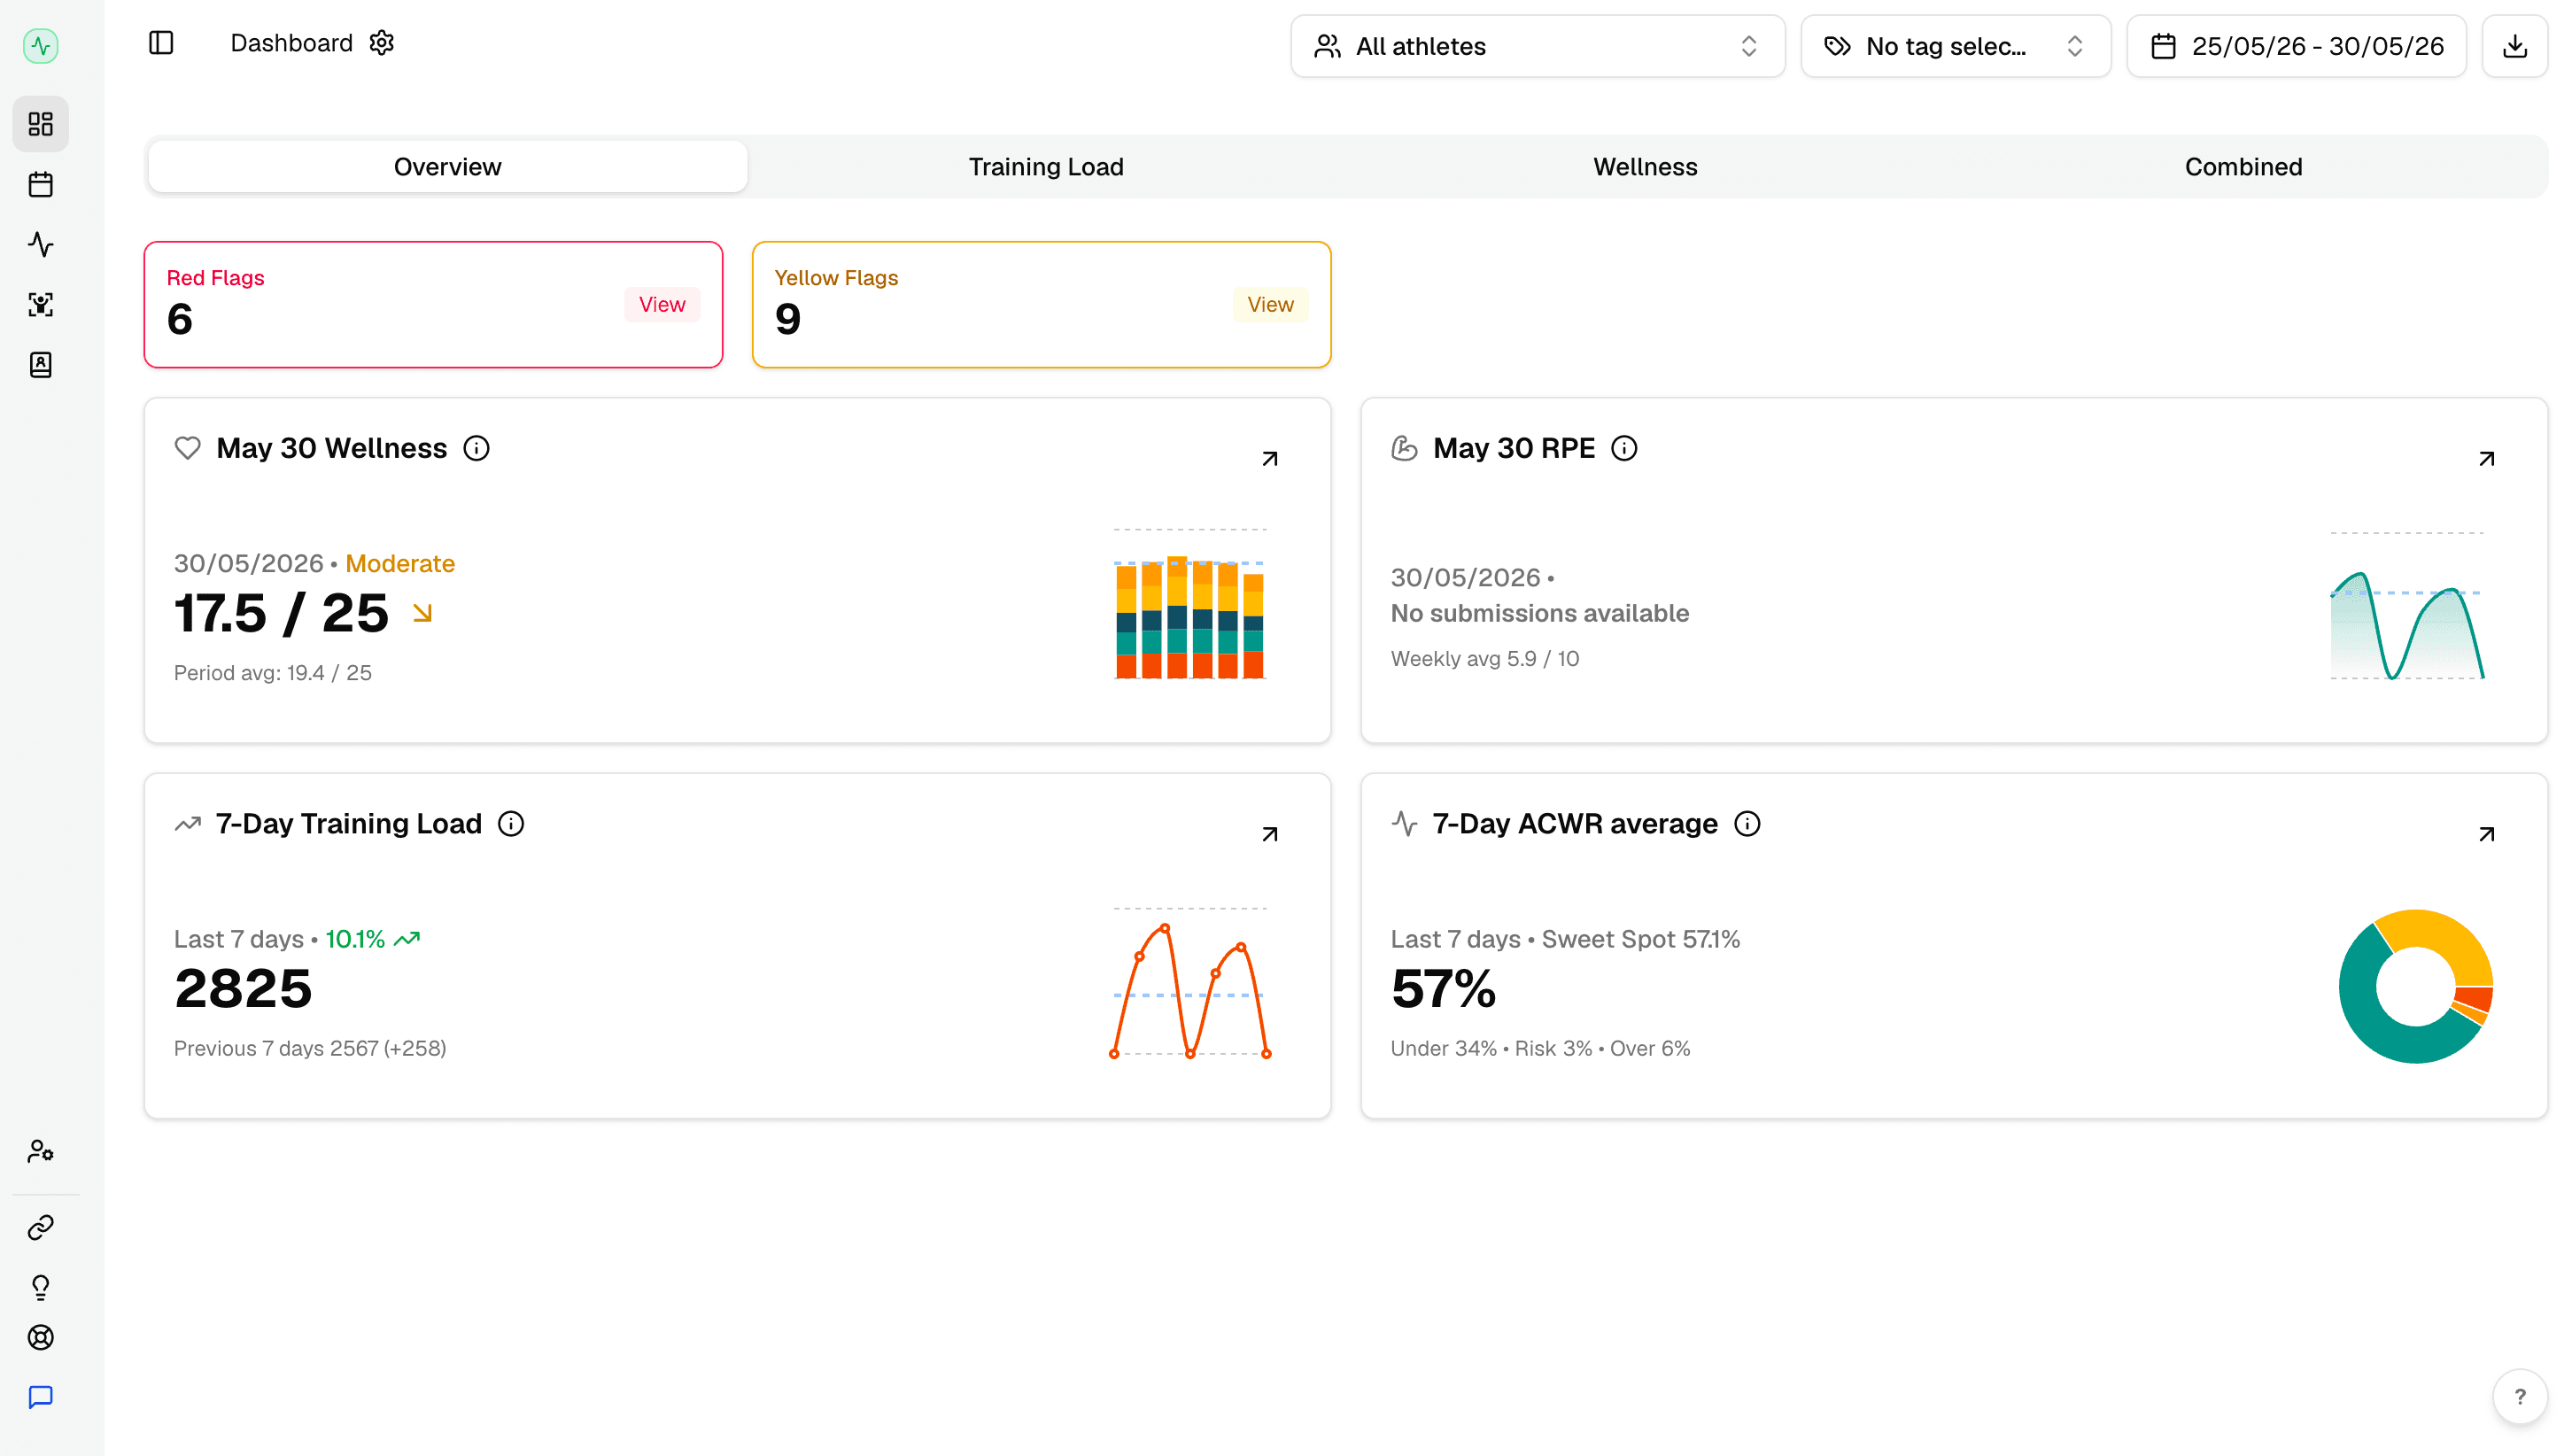
Open the dashboard and you see who's outside the normal range before you see anything else. Fractall checks every athlete against the ACWR thresholds you set and flags them red or yellow. There's nothing to sort and no spreadsheet formula to keep alive through a season.
Red and yellow flags
An athlete crossing an ACWR threshold gets surfaced on its own. There are flags for undertraining, risk and overtraining, plus critical and high strain.
Thresholds you control
The undertraining, risk and overtraining boundaries start at 0.8, 1.3 and 1.5. Change them in settings and they apply across the squad.
ACWR distribution
See what share of your athletes sit in each zone over the last seven days, so you read the spread instead of one squad average.
Filters
Scope everything to selected athletes, a date window, or the training tags your club has created.
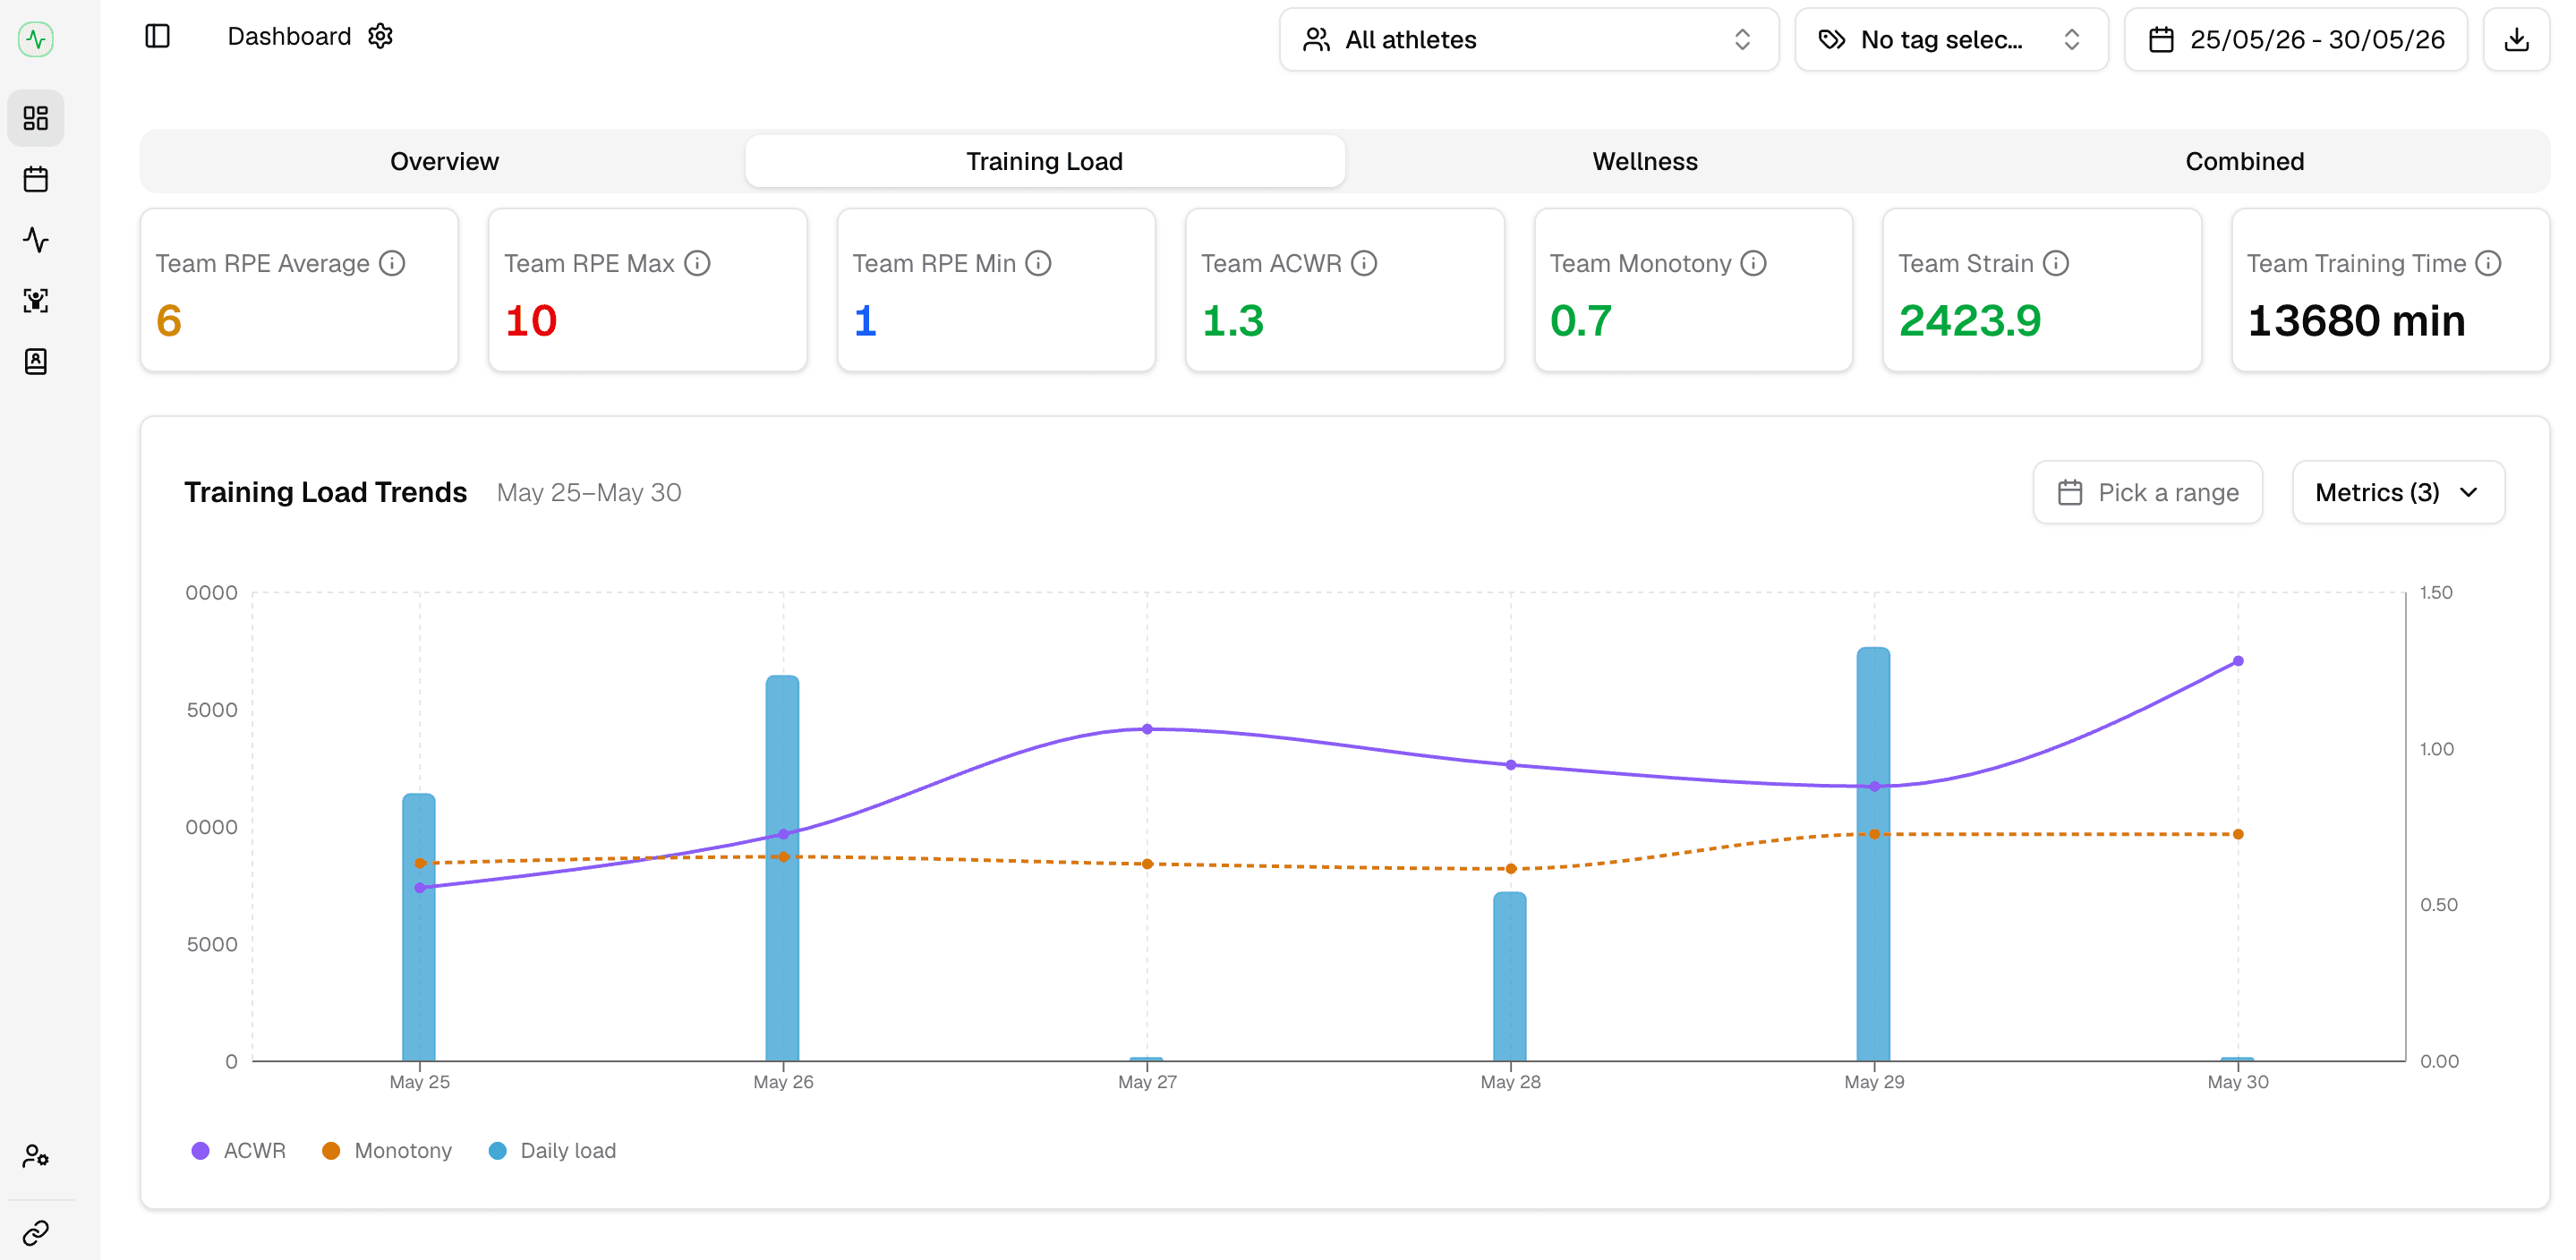
Athletes submit an RPE from 0 to 10 after each session, from their phone. Session load is that rating multiplied by session duration. Weekly load, ACWR, monotony and strain all build from there, each one colour coded against its own thresholds.
ACWR four ways
The default divides 7-day average load by 21-day average load. You can switch the chronic window to 28 days, and to uncoupled versions that keep the acute days out of the chronic average.
Colour coded zones
Below 0.8 reads as undertraining, 0.8 to 1.3 as the sweet spot, 1.3 to 1.5 as risk, above 1.5 as overtraining.
Monotony and strain
Monotony is the mean of your seven daily loads over their standard deviation, so a week with no variation scores high. Strain multiplies monotony by weekly load. Both flag past their thresholds.
sRPE average, max and min
The max tells you who pushed hardest. The min tells you who's underloaded, or who isn't reporting honestly.
Training time
Minutes logged across the range, per athlete and per squad.
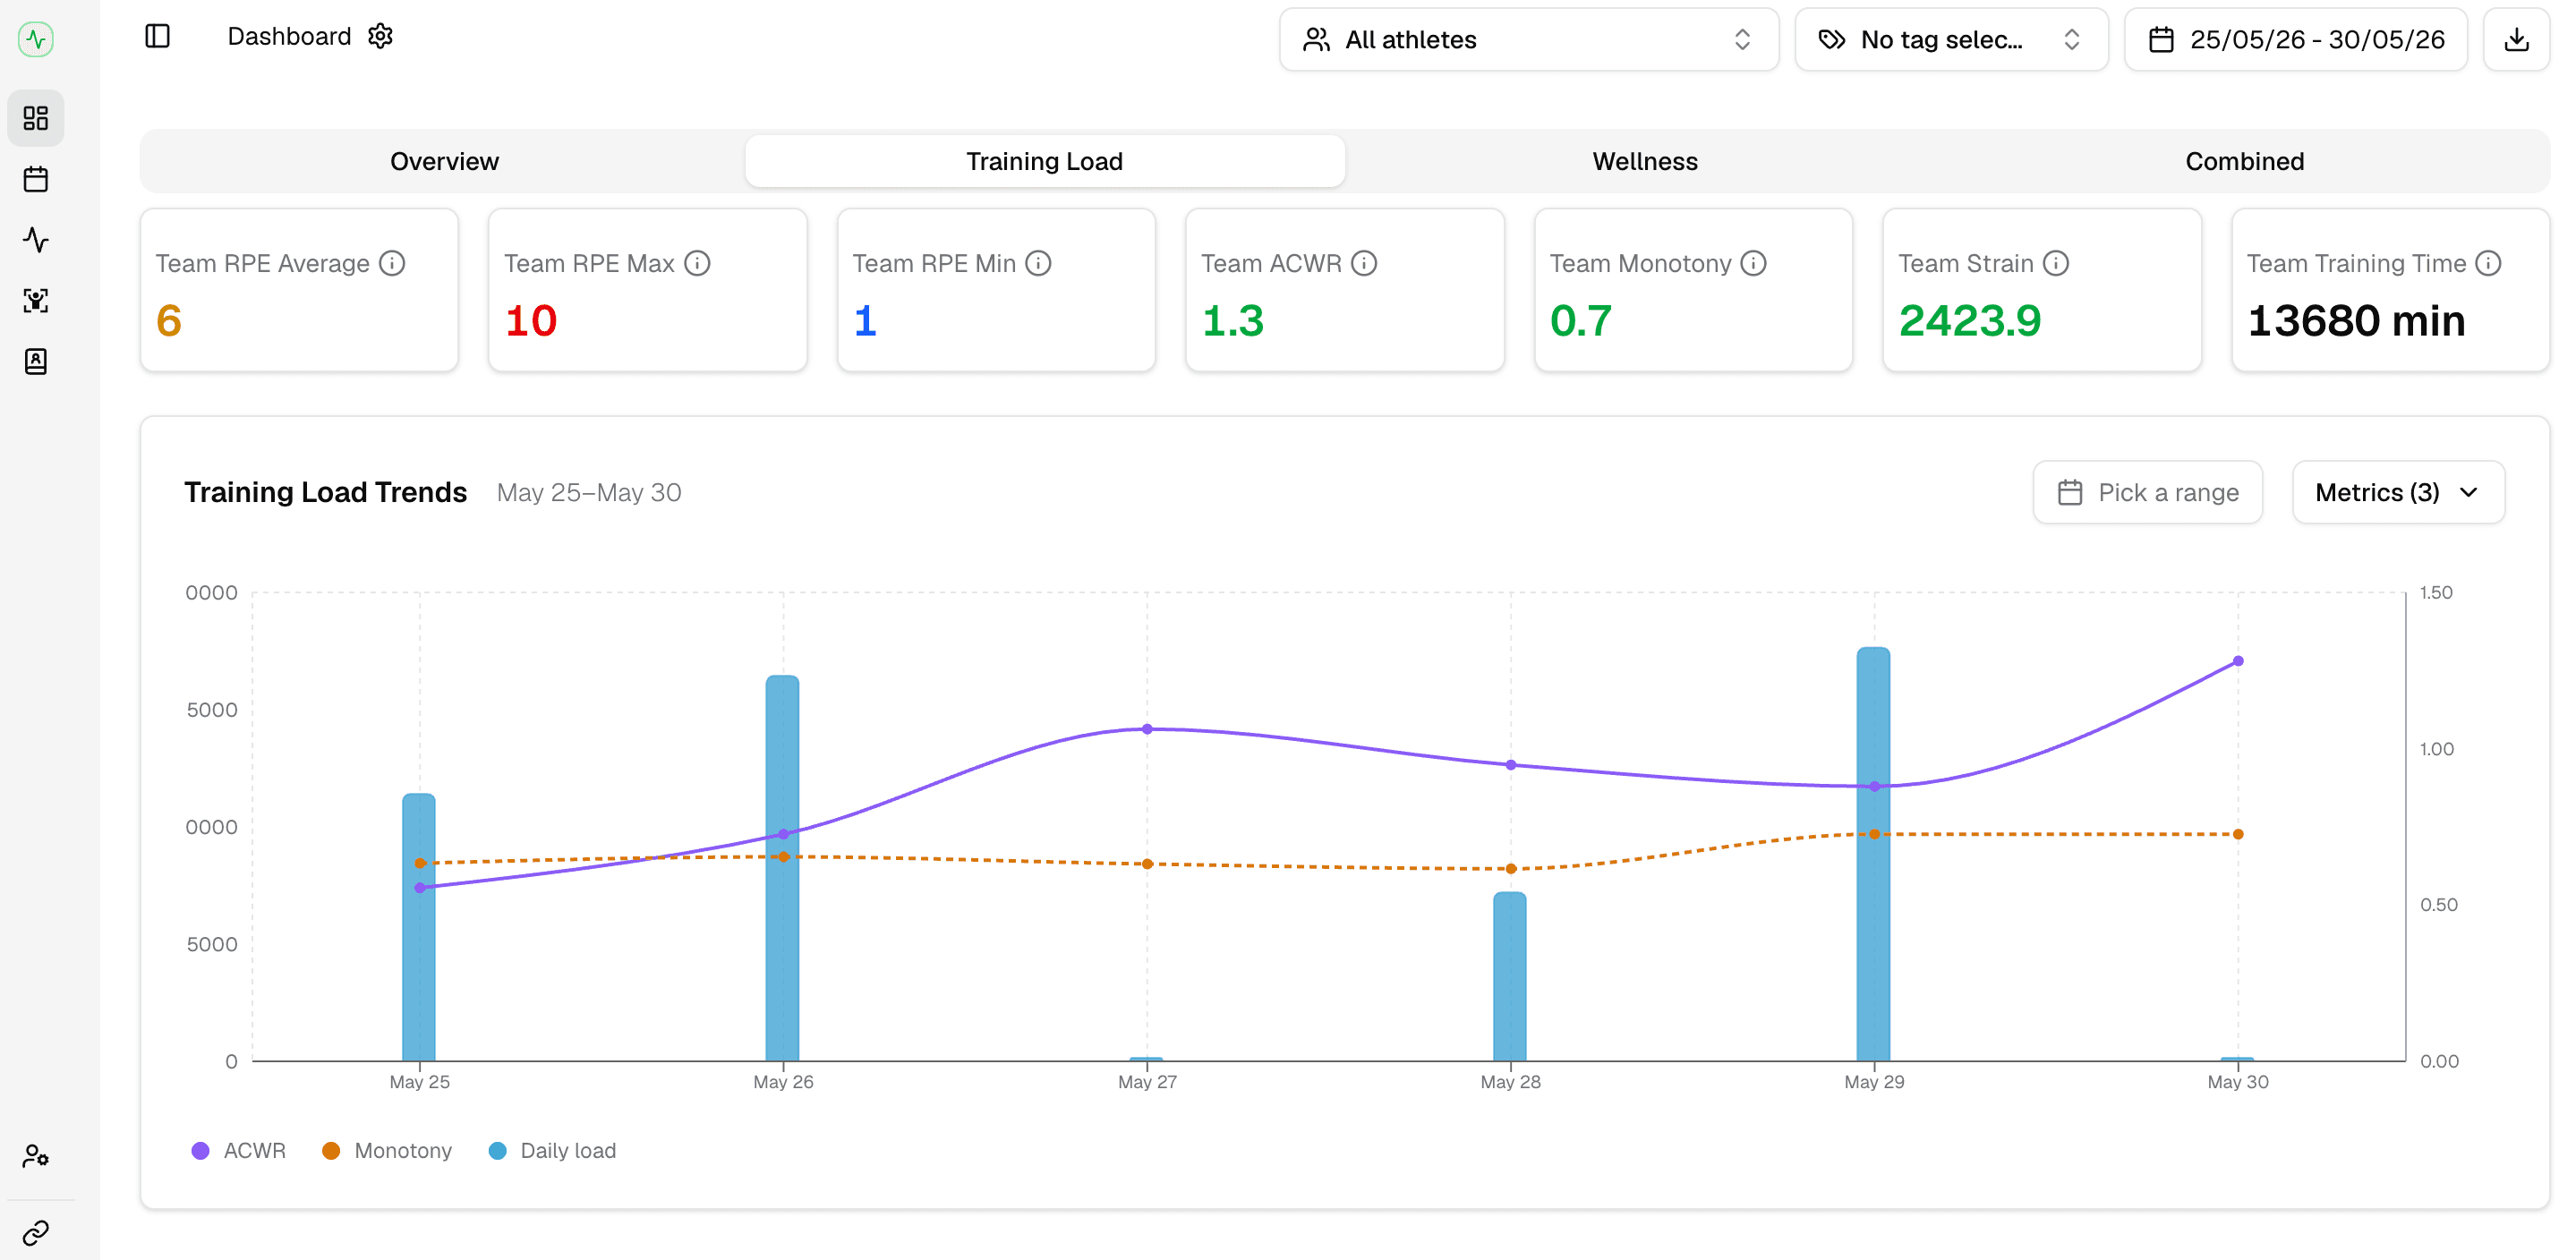
Daily load as bars, ACWR as a line, across whatever window you pick. Toggle each series on and off. A spike that disappears inside a weekly total is obvious once you can see the shape of the block day by day.
Four toggleable series
Daily load, ACWR, monotony and strain, each on or off.
Compare two windows
Overlay a second date range on the same chart to put this block next to the last one.
Any date range
A single microcycle, a full mesocycle, or the season to date.
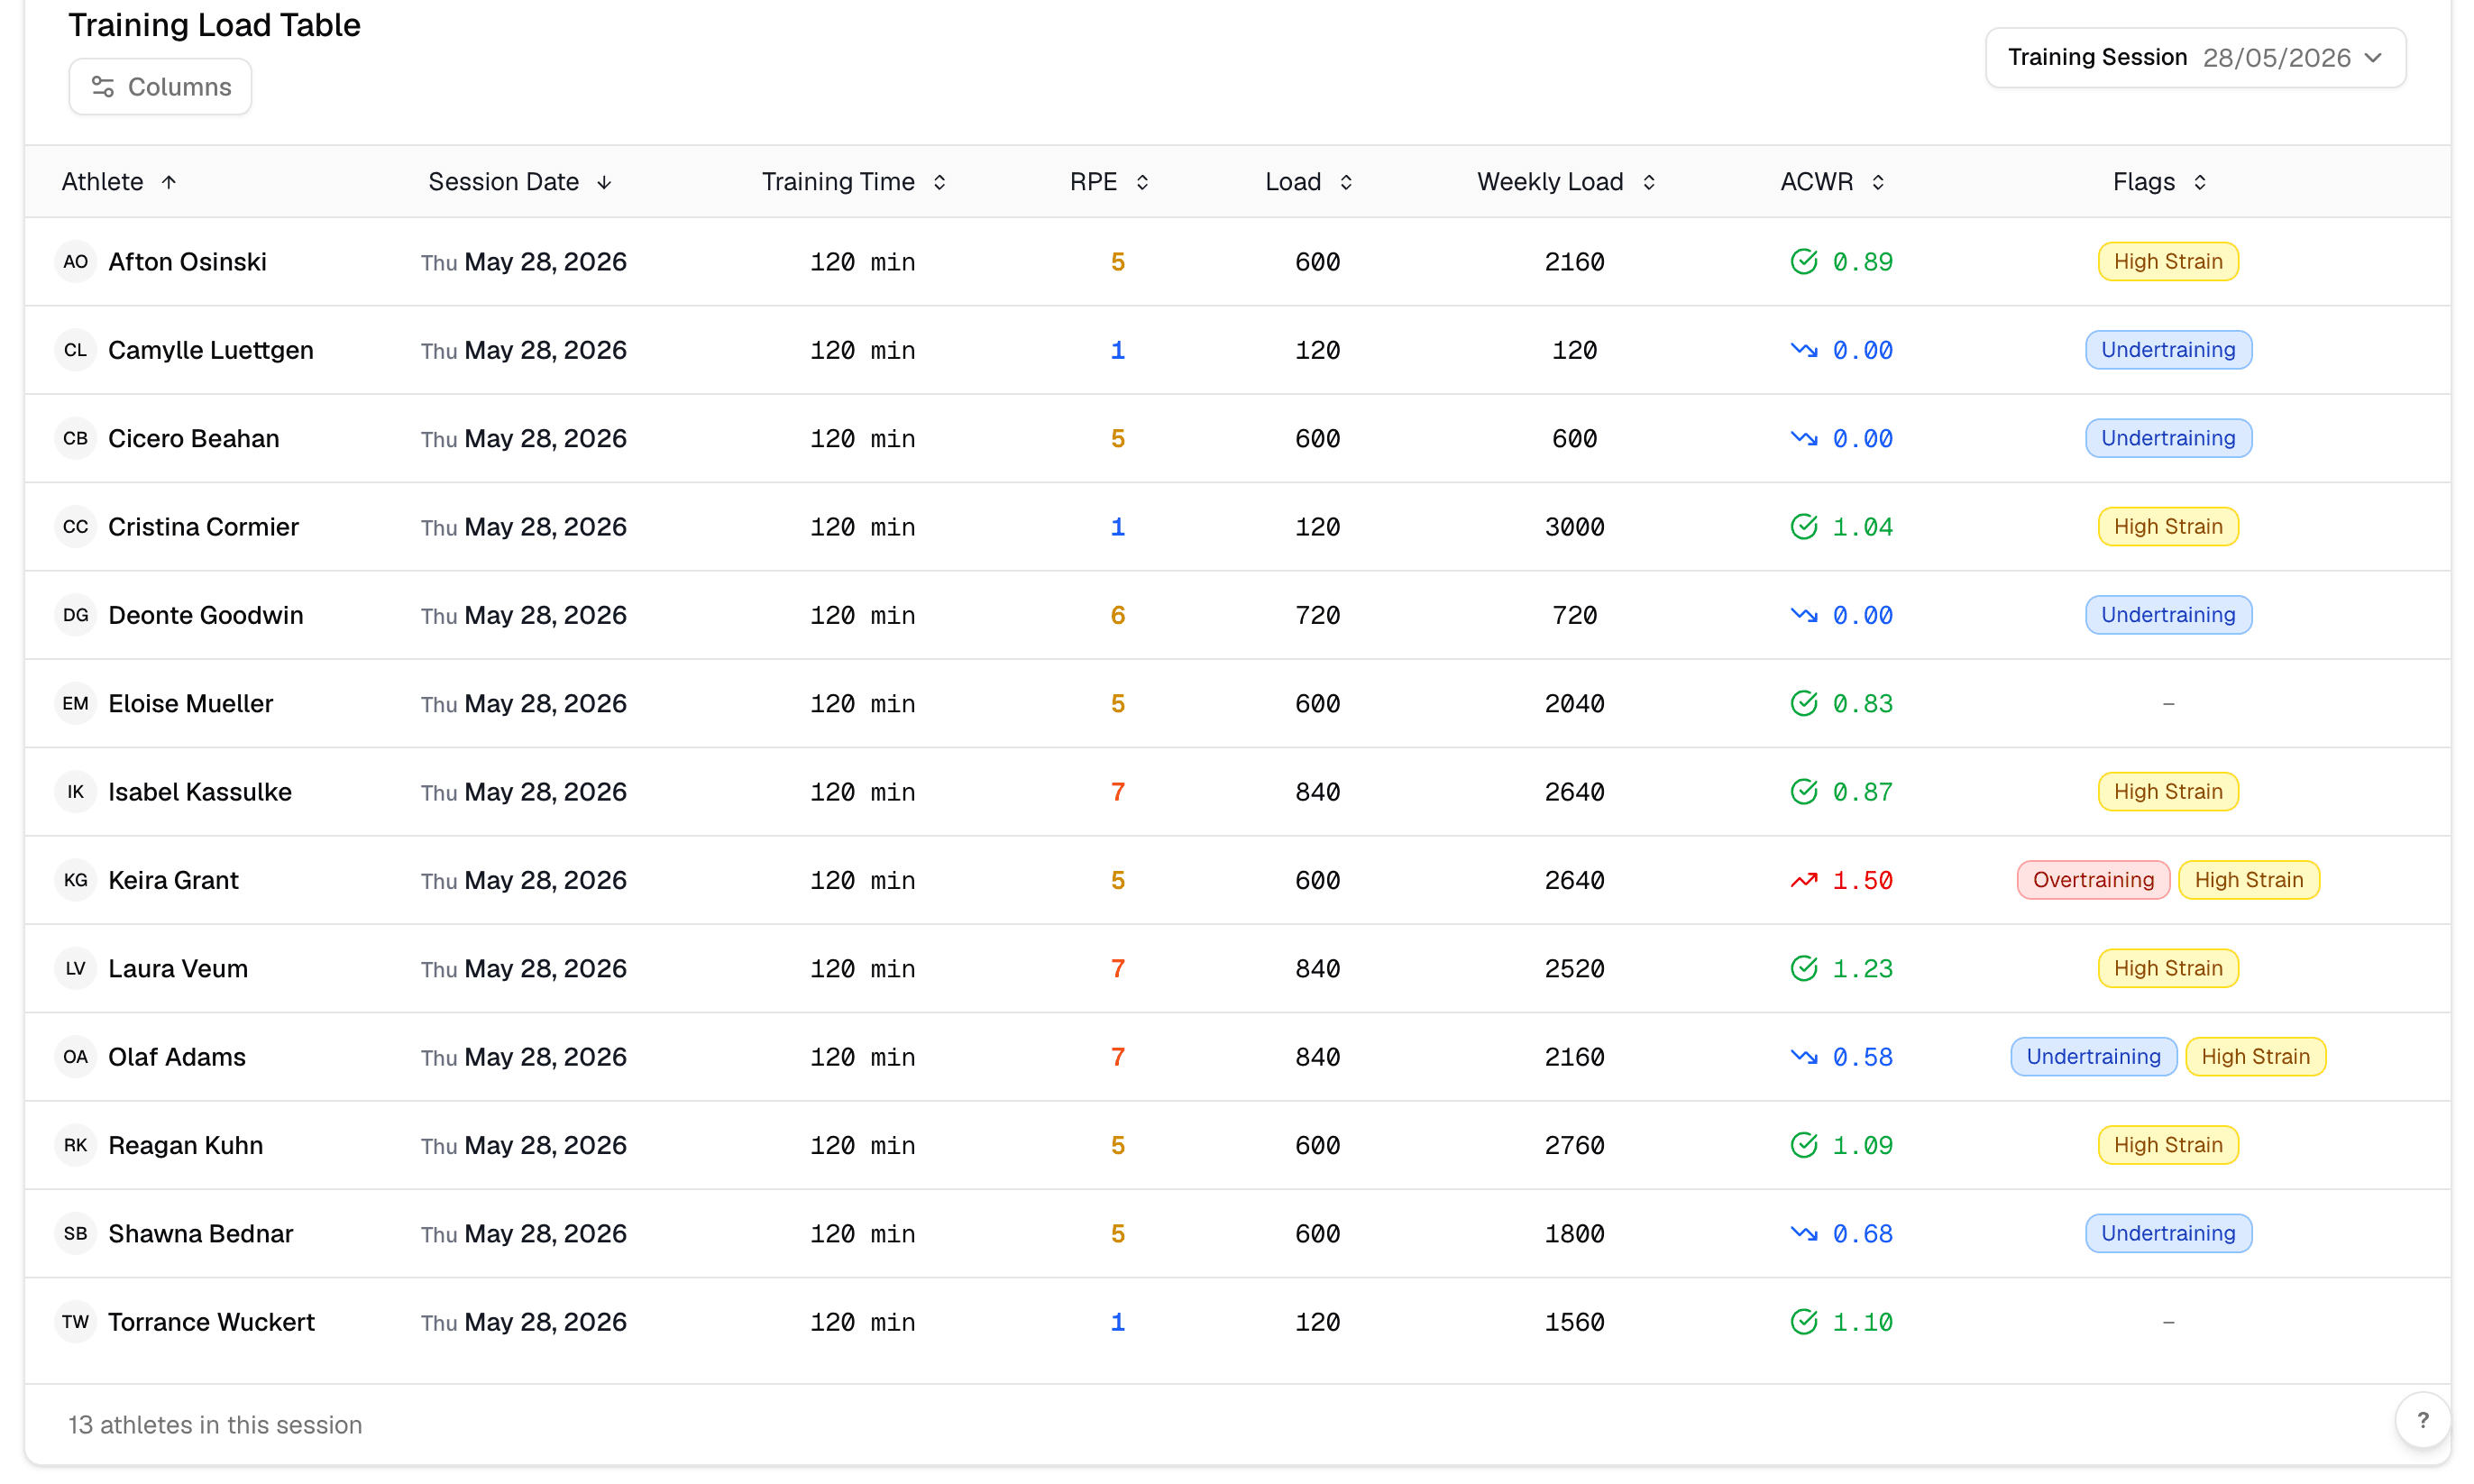
The table lists each session by athlete with the date, duration, sRPE, session load, weekly load and ACWR. Sort any column. Filter by athlete, tag, position, or a numeric range on any metric. It's where you go when the trend chart shows a spike and you need the session that caused it.
Per session detail
Session name, date, duration, sRPE, calculated load and the flags that fired.
Sortable and filterable columns
Order by load to find the heaviest sessions, or filter ACWR to a band to see only the athletes sitting in it.
Athlete notes
The note an athlete left with their sRPE expands inline on their row.
Start a free trial and have your athletes submitting inside a week. There's no hardware to buy and no setup fee.
