

4 Weeks Free Access (cancel anytime)
Interactive GuideGPS monitoringExternal loadFootball coaching

GPS Metrics in Football: What to Track and What Can Wait

The four GPS metrics football coaches should review weekly, the two to keep in reserve, and the columns that can wait until later. Start with these four.

Published
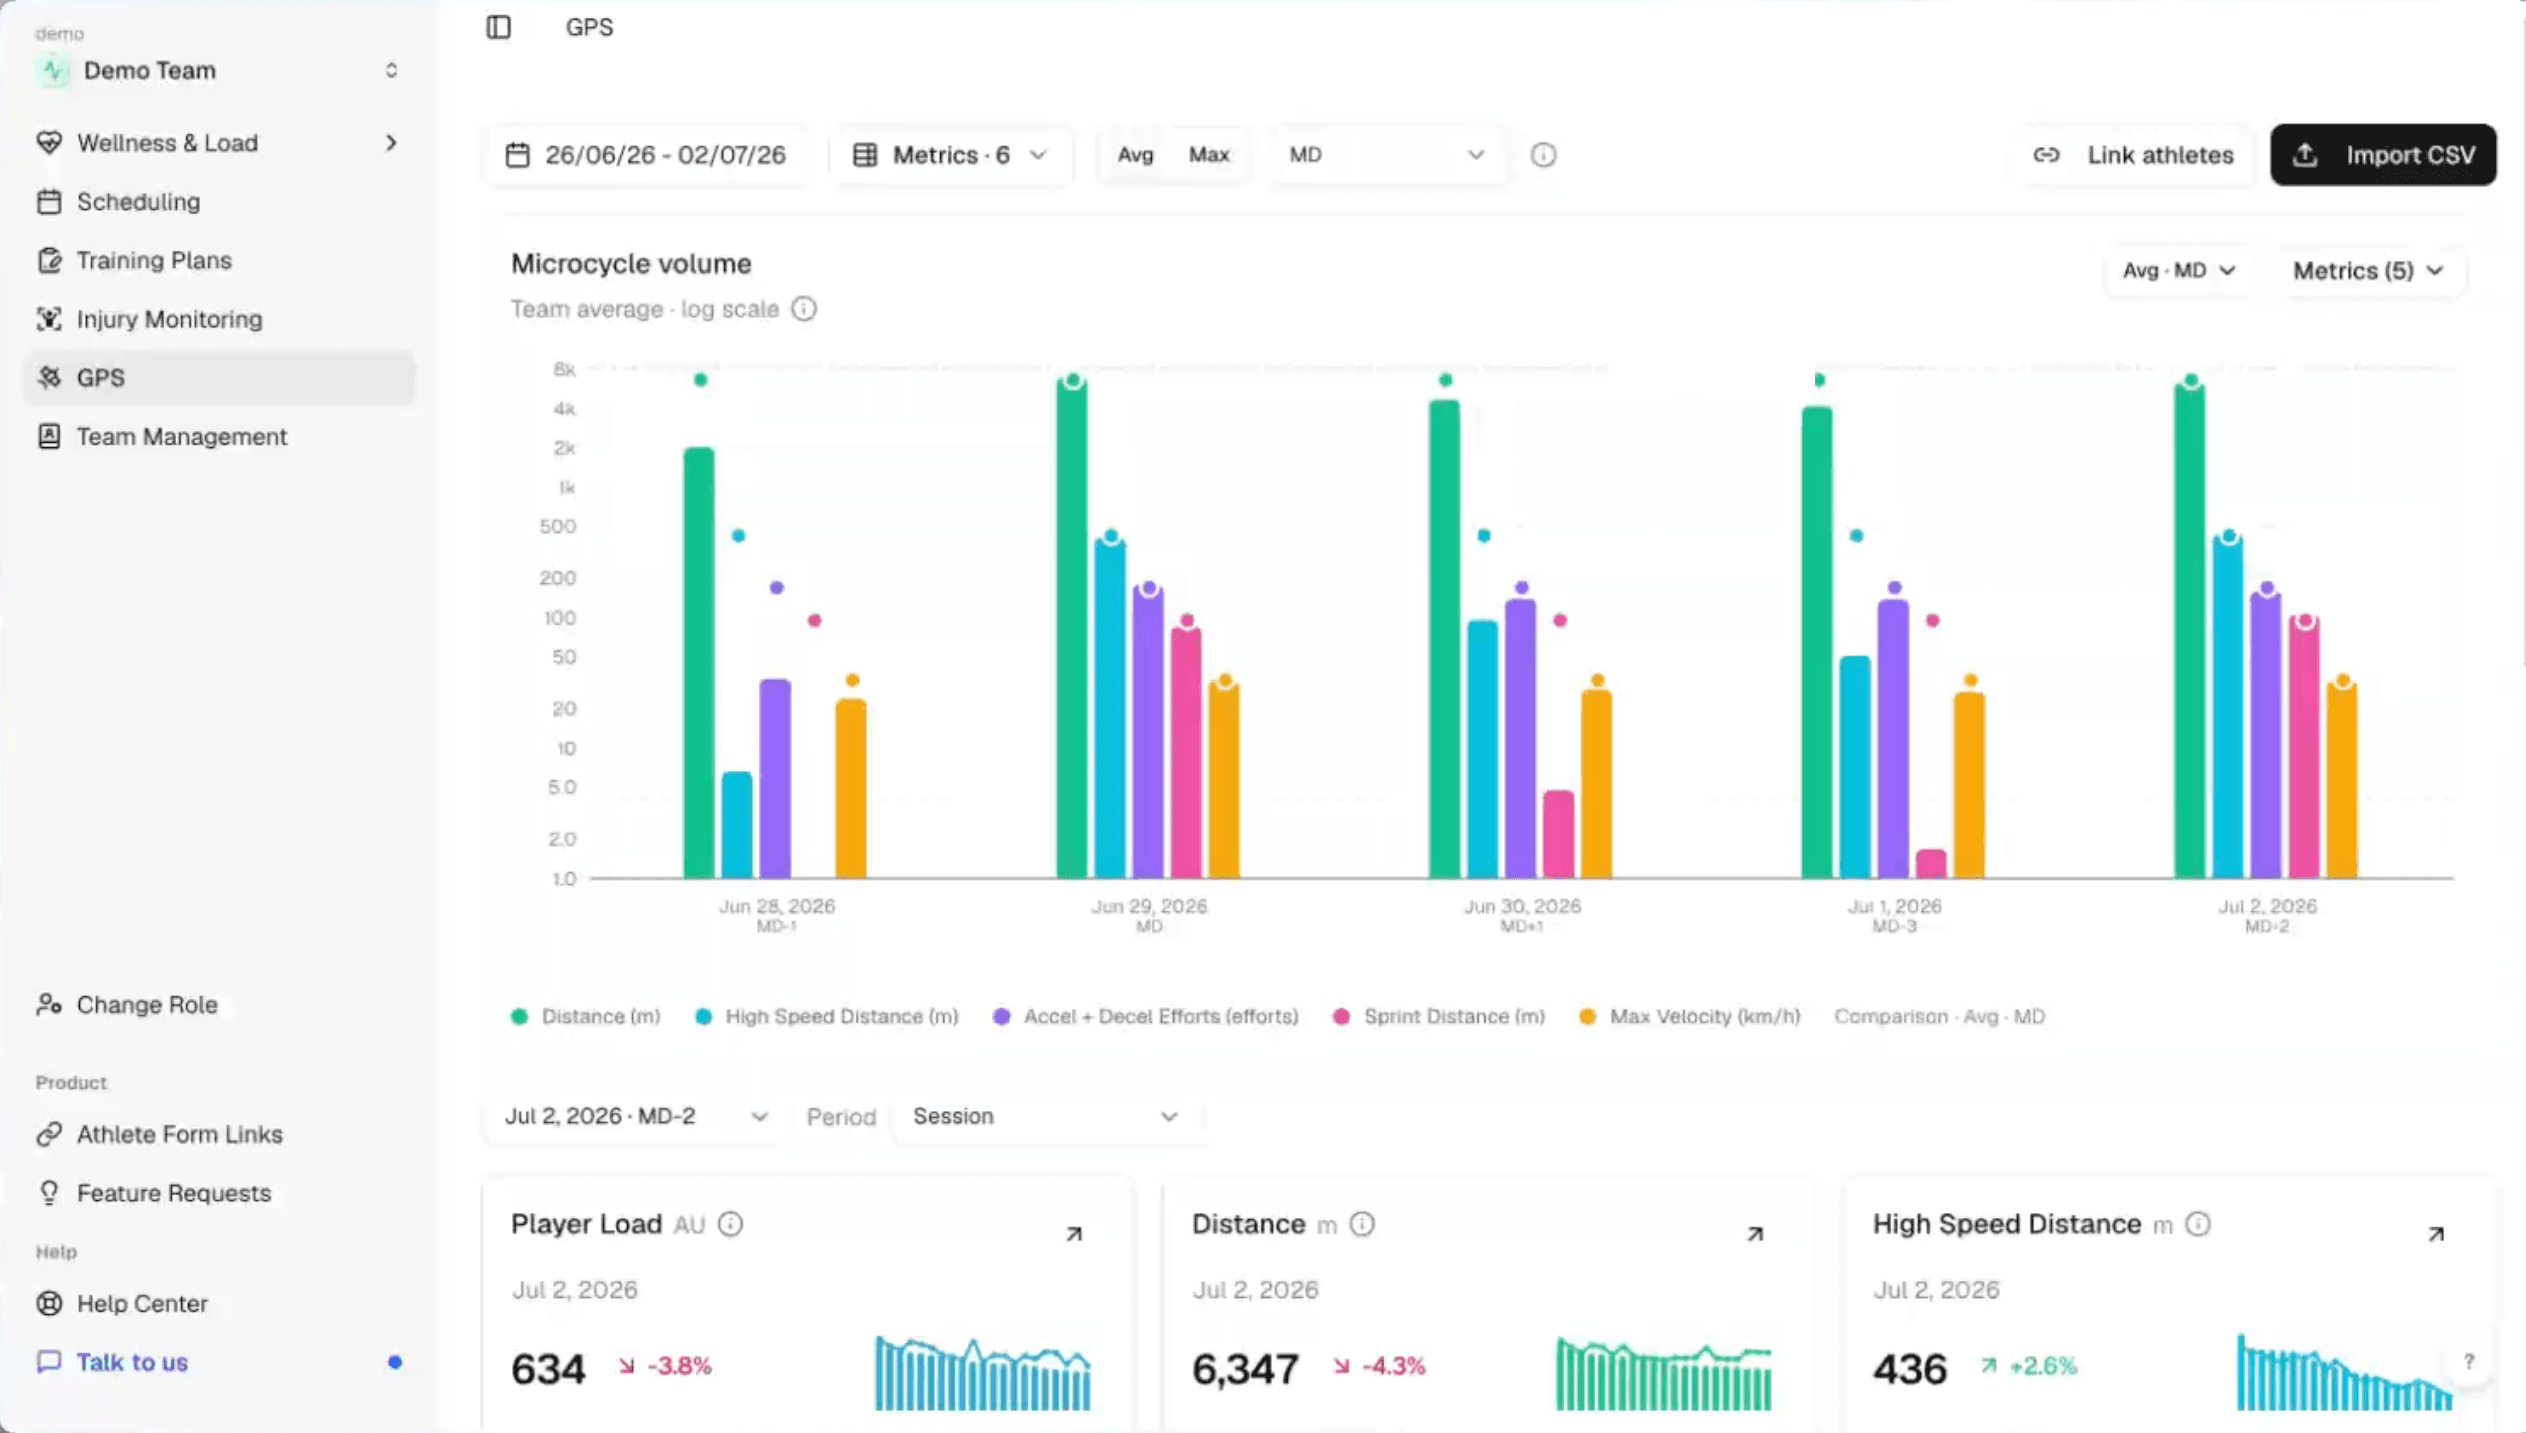
Fractall GPS dashboard showing microcycle volume by matchday with distance, high speed distance and sprint distance per session.

Quick answer

Four metrics carry the weekly decision

Total distance, high speed distance, sprint distance, and accelerations plus decelerations. Max velocity and player load are worth a look when something changes. The rest of the export is the second pass, once those four are routine.

Why so few

The units arrive, the first export lands, and it's a file with more columns than you have players. Somewhere in there is the number that should change what you do on Thursday. Most of the file won't. GPS metrics in football are useful in proportion to how few of them you actually read.

Who this is for

A club with a full-time sports scientist can afford to look at everything and work out what matters over a season. A club where the same person runs the session, drives the van, and does the analysis on Sunday night cannot. This guide picks four metrics to review every week, two to keep in reserve, and explains what the rest of the columns are doing there.

The weekly four

Which GPS metrics should a football coach track weekly?

Track total distance, high speed distance, sprint distance, and accelerations plus decelerations. Those four cover volume, exposure to fast running, and the mechanical work that distance alone hides.

MetricWhat it tells youHow to read it
Total distanceSession volume, and nothing about intensity.A reference to read the other three against, not a verdict on its own.
High speed distanceMetres above your high speed threshold.The one to watch most closely. Follow the trend per player, not the absolute number.
Sprint distanceMetres close to top speed.Shows who is getting genuine sprint exposure in training and who is not.
Accelerations and decelerationsMechanical efforts that distance columns miss.Most informative on small-sided days, where ground covered stays low.

Total distance is the baseline

On its own it tells you very little about how hard a session was, because a slow 6km possession game and a sharp 6km finishing session sit at the same number. What it gives you is a volume reference. If total distance is flat but high speed distance has doubled, that's a different week even though the headline looks identical.

High speed distance is the one to watch

Sharp increases in high speed running have been associated with hamstring strain injury, and hamstrings are what small clubs lose players to most weeks. There is no single agreed cut-off for what counts as high speed. Providers and research groups set it differently, so your number isn't comparable to another club's. Keep your own threshold consistent and read the trend.

Sprint distance answers a narrower question

Did this player run at close to top speed this week, and how far. Players who never reach sprint distance in training are the ones whose first genuine sprint happens in a match. That's the exposure gap worth knowing about before the match, not after.

Accelerations and decelerations catch hidden work

A player doing repeated short bursts in a small-sided game can finish with modest distance and a lot of mechanical work. Decelerations in particular load the tissue hard and cost very little ground.
The high speed running association comes from Duhig et al. (2016), British Journal of Sports Medicine 50(24), which tracked GPS running distances across two Australian Football League seasons and found higher than typical high speed running in the week before injury was associated with increased hamstring strain injury risk. Australian football is not football, and an association is not a prediction. Read it as a reason to watch sharp weekly increases, nothing stronger.

Two in reserve

Max velocity and player load, for when something changes

Neither belongs in a weekly volume review. Both are useful when a player looks off and you want a second angle.

Max velocity is a readiness check

The top speed reached in the session. It isn't a load metric. A player who normally tops out around a familiar number and comes in well below it, in a session where the chance to sprint existed, is telling you something before any wellness form does. Read it against their own history, never against a squad average.

Player load is provider-specific

The accelerometer figure your provider calculates, and every provider calculates it slightly differently. Inside one squad on one system it works as a general session-to-session stress number. Across systems or clubs it doesn't compare, so treat it as a rough internal check rather than something you build decisions on.

Read these later

Which GPS columns can wait until later?

Most columns in an export exist because someone needed them for a research question. At a club without an analyst, they are the second pass rather than the first.

Come back to these once the four are routine

  • Per-minute versions of metrics you already track, unless you are comparing a 40-minute session to a 90-minute one.
  • Metabolic power and energy-cost columns, which are modelled estimates built on assumptions about running economy.
  • Distance split across five or six speed zones, when two bands already do the work.
  • Anything derived from heart rate when you are not collecting heart rate.
  • Positional averages used as a benchmark against your own players.

Why these come second

Per-minute figures mislead when durations are similar. Modelled power columns rarely change a decision that high speed distance and accelerations didn't already flag. Extra speed zones mostly split small numbers into smaller ones. And comparing your left back to a published positional average tells you about the other squad's game model, not about your player.

None of this is bad data

It's data that costs attention you need for the four metrics that will actually change Thursday's session. Once those four are routine, or once the club has someone whose job is analysis, this list is the next layer to read.

Weekly review

How to read the four metrics across a training week

Compare like day with like day. GPS numbers mean almost nothing as a single session in isolation, and quite a lot when this week's MD-3 sits next to last week's MD-3.

  1. 1

    Put the sessions in matchday order

    MD-4, MD-3, MD-2, MD-1, MD, MD+1. The label matters more than the calendar date, because a Tuesday in a one-match week and a Tuesday in a three-match week are different animals.

  2. 2

    Read total distance for the shape of the week

    You are looking for whether the week loaded where you planned it to load.

  3. 3

    Read high speed and sprint distance per player

    Flag anyone whose exposure jumped sharply against their own recent weeks, and anyone sitting near zero who is expected to start.

  4. 4

    Read accelerations on the small-sided days

    This is where distance under-reports the work most.

  5. 5

    Check the outliers against something that is not GPS

    Session RPE, sleep, soreness, a body pain report. External load tells you what the player did, not what it cost them.
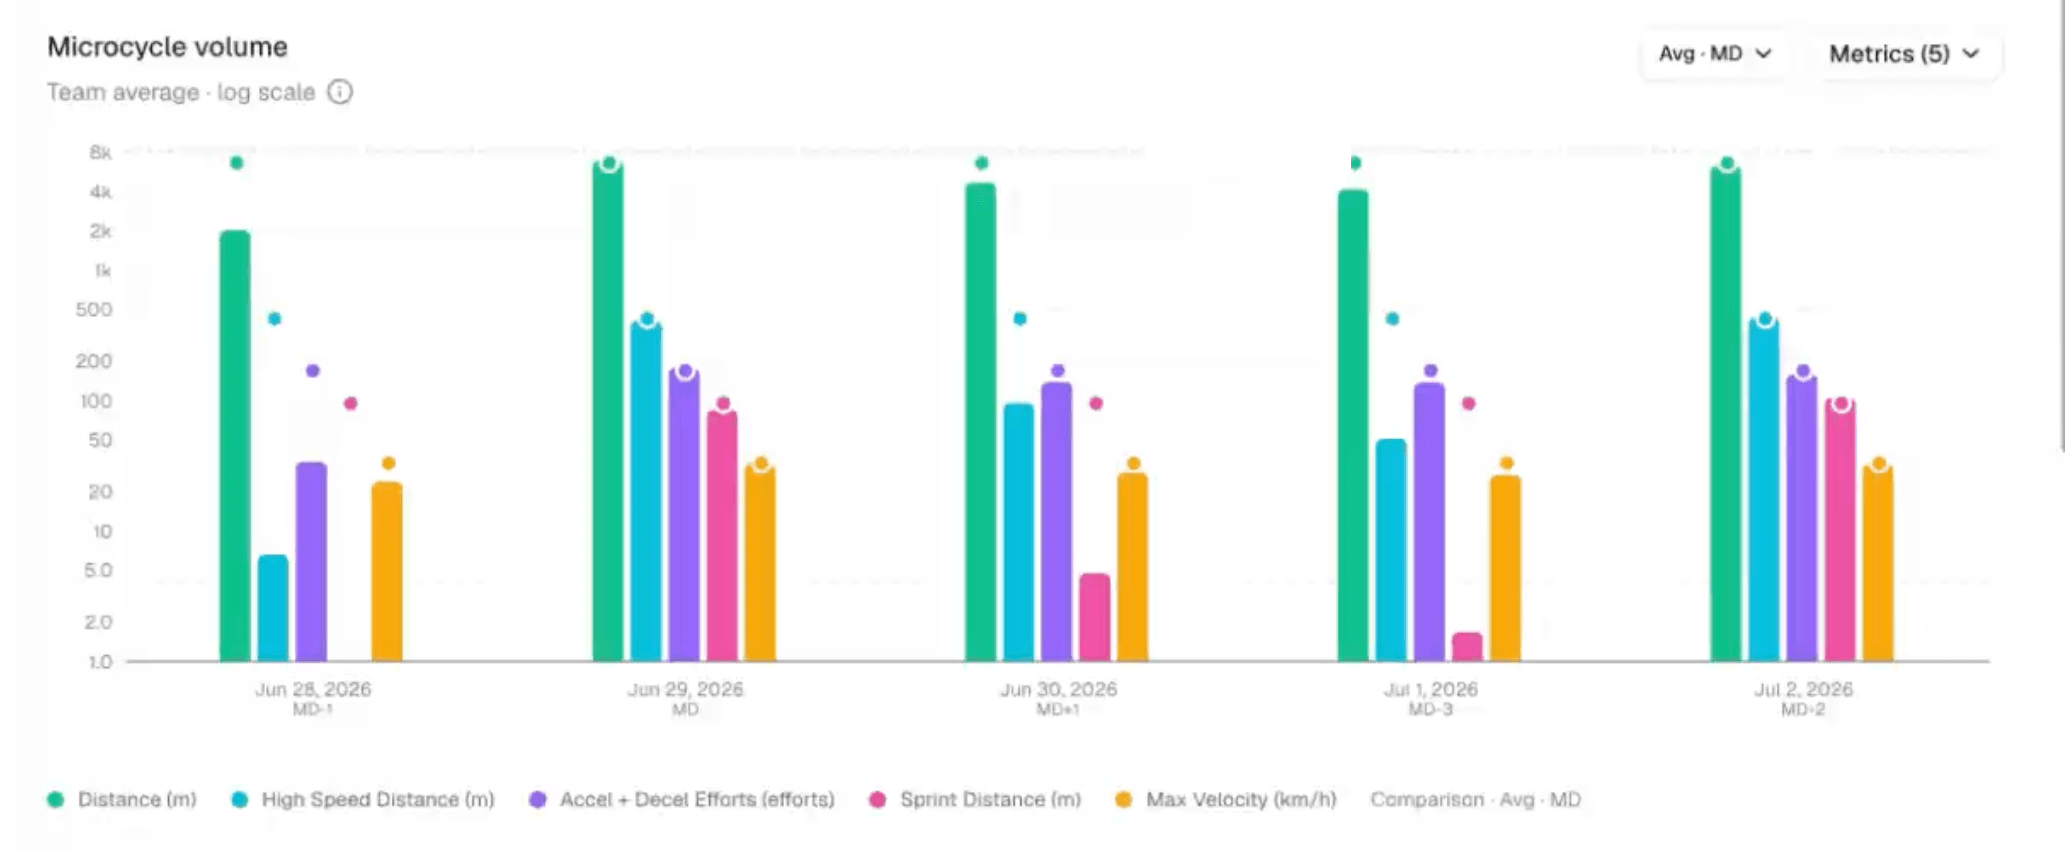
Microcycle volume chart comparing distance, high speed distance, accelerations and sprint distance across MD-3 to MD+1 in Fractall.
Sessions charted in matchday order, so this week's MD-3 lands next to last week's.

The mistake worth avoiding

Two players can cover the same distance at the same speeds and finish the session in completely different states. Session RPE closes that gap, which is why the difference between internal and external load is worth getting straight before you spend much time in the GPS file. If you are still building the weekly structure itself, the matchday-based load plan is the frame these numbers slot into.

Limits

What GPS data will not tell you

Two things worth saying plainly before anyone builds a selection policy on an export.

It will not predict injuries

Load monitoring shifts the odds by catching sharp changes in exposure early, and that is worth doing. No metric in the export identifies who is about to get hurt. Read the numbers as a prompt to ask a question.

It will not tell you if a session was good

A tactically sharp session and a physically demanding one are not the same thing, and GPS only sees one of them.

In Fractall

Reading the four metrics without re-typing a row

Fractall reads the CSV your provider already produces and charts it in matchday order beside the internal load you already collect.

From export to squad chart

1

Run your normal post-session export and import the CSV.

2

Link the athlete names in the file to your squad, once.

3

Read sessions labelled by matchday, charted across the microcycle.

Catapult, OliverSportAI and StatSports exports are handled directly. Any other provider works through manual mapping at import time. Which metrics you see depends on what your provider exports.
Fractall GPS session KPI cards showing player load, distance and high speed distance with change against the previous period.
Session cards show the change against the previous period, next to the RPE for the same day.

See the GPS module

Distance, high speed running, sprint distance, accelerations, max velocity and player load, charted by matchday next to session RPE and ACWR.

GPS and external load monitoring

FAQs

GPS metrics questions coaches ask

Short answers for staff setting up a weekly external load review.

What GPS metrics matter most in football?

Total distance, high speed distance, sprint distance, and accelerations plus decelerations cover most of what a coach needs weekly. Total distance gives you volume, the two speed metrics give you fast-running exposure, and the acceleration count picks up mechanical work that distance misses.

How many GPS metrics should a small club track?

Four for the weekly review, plus two kept in reserve for when something looks unusual. A club without a full-time analyst gets more from reading four metrics every week than from reading twenty occasionally.

Is high speed distance the same as sprint distance?

No. High speed distance counts every metre above your high speed threshold. Sprint distance counts metres above a higher threshold, closer to top speed. A player can accumulate plenty of high speed distance without ever sprinting.

Do GPS numbers compare between clubs or providers?

Not reliably. Speed thresholds, player load calculations and filtering differ between providers, so an absolute value from one system does not map onto another. Compare a player against their own history on your own system.

Do I need GPS to monitor training load in football?

No. Session RPE multiplied by duration gives you a working internal load system with no hardware at all, and for many small clubs that is the better place to start. GPS adds the external side once the internal habit is running.

Can GPS data predict injuries?

No. Sharp increases in high speed running have been associated with higher injury risk in the research, but association is not prediction. Treat the data as a flag for a conversation with the player, not a forecast.

Put GPS next to the rest of the picture

Import your provider's export and read it beside session RPE, ACWR, wellness and body pain for the same squad.

Try Fractall free

Related guides