

GPS Metrics Explained: A Complete Glossary for Coaches
Every GPS metric in plain English: all 108 columns your provider can export, grouped by what they measure, with the thresholds that make them comparable.
Published
Reference
What every GPS metric means, in one place
Each provider documents its own metrics and nobody documents the vocabulary as a whole. This is that page: 108 metrics, grouped by what they measure, defined in the language a coach would use.
Quick answer
Thresholds
are settings, not standards
What counts as a sprint or a hard acceleration is a number someone configured. Two accurate systems can disagree about the same run.
AU
means arbitrary units
A formula output with no physical unit. Player Load, Dynamic Stress Load and Speed Intensity are all AU, and none are comparable across providers.
23 metrics
Acceleration and deceleration metrics
How often the athlete changed speed, how hard, and over what distance. Counts, rates, peaks, distances and intensity bands.
| Metric | Unit | What it measures |
|---|---|---|
| Accel + Decel Efforts | efforts | Every effort past the threshold in both directions, added together. |
| Acceleration Efforts | efforts | How many times the athlete crossed the acceleration threshold. |
| Deceleration Efforts | efforts | How many times they braked harder than the threshold. |
| Max Acceleration | m/s² | The hardest single acceleration reached in the session. |
| Max Deceleration | m/s² | The hardest single braking effort reached in the session. |
| Accelerations Per Minute | efforts/min | Acceleration efforts divided by session minutes. |
| Decelerations Per Minute | efforts/min | Braking efforts divided by session minutes. |
| Accel + Decel Efforts Per Minute | efforts/min | The combined speed-change rate, volume expressed as intensity. |
| Acceleration Density | m/s² | Average of every acceleration and braking value, ignoring direction. Touches no threshold. |
| High Acceleration Distance | m | Metres covered while accelerating in the high-intensity band. |
| Max Acceleration Distance | m | Metres covered while accelerating in the top band. |
| High Deceleration Distance | m | Metres covered while braking in the high-intensity band. |
| Max Deceleration Distance | m | Metres covered while braking in the hardest band. |
| High Acceleration Efforts | efforts | Accelerations in the high-intensity band only. |
| Max Acceleration Efforts | efforts | Accelerations in the top band only. |
| High Deceleration Efforts | efforts | Decelerations in the high-intensity band only. |
| Max Deceleration Efforts | efforts | Decelerations in the hardest braking band only. |
| Acceleration B1-3 Efforts (Gen 2) | efforts | Every Gen 2 acceleration effort across all three bands. |
| Deceleration B1-3 Efforts (Gen 2) | efforts | Every Gen 2 deceleration effort across all three bands. |
| Acceleration B2-3 Efforts (Gen 2) | efforts | Gen 2 accelerations in the two higher bands. |
| Deceleration B2-3 Efforts (Gen 2) | efforts | Gen 2 decelerations in the two hardest braking bands. |
| Deceleration B3 Efforts (Gen 2) | efforts | Gen 2 decelerations in band 3 alone, the hardest braking there is. |
| Acceleration B1-3 Distance (Gen 2) | m | Metres covered while performing Gen 2 acceleration efforts. |
9 metrics
Speed metrics
How fast the athlete was moving: peak speed, efforts past a speed threshold, and running rates.
| Metric | Unit | What it measures |
|---|---|---|
| Max Velocity | km/h | The highest speed reached during the session. |
| Max Vel (% Max) | % | Session peak speed as a percentage of the athlete's own maximum. |
| Sprint Efforts | efforts | Runs that crossed the sprint threshold, 7 m/s by default. |
| High Speed Efforts | efforts | Runs that crossed the high-speed threshold, 5.5 m/s by default. |
| Average Speed | m/min | Distance covered per minute of activity. The standard work-rate figure. |
| Speed Intensity | AU | A weighted accumulation of instantaneous speed. Proprietary to STATSports. |
| Velocity B6+ Efforts (Gen 2) | efforts | Catapult's band-system count of efforts above 7 m/s. |
| High Speed Distance Per Minute | m/min | High-speed metres accumulated per minute. |
| Sprint Distance Per Minute | m/min | Sprint metres accumulated per minute. |
18 metrics
Distance metrics
How far the athlete moved, in total and inside each speed band. This is the group with the most duplicate naming.
| Metric | Unit | What it measures |
|---|---|---|
| Distance | m | Total metres covered during the session. |
| Distance Per Minute | m/min | Total distance divided by session minutes. |
| High Speed Distance | m | Metres above the high-speed threshold, 5.5 m/s (19.8 km/h) by default. |
| Sprint Distance | m | Metres above the sprint threshold, 7 m/s (25.2 km/h) by default. |
| Distance Zone 5 | m | Metres inside speed zone 5, high-speed running. |
| Distance Zone 6 | m | Metres inside speed zone 6, sprinting. |
| Explosive Distance | m | Hard accelerations and decelerations below high-speed pace. HMLD minus high speed running. |
| Velocity Band 1 Distance | m | Metres while standing or barely moving. |
| Velocity Band 2 Distance | m | Metres while walking. |
| Velocity Band 3 Distance | m | Metres while jogging. |
| Velocity Band 4 Distance | m | Metres while running at a moderate pace. |
| Velocity Band 5 Distance | m | Metres at high intensity, below sprint speed. |
| Velocity Band 6 Distance | m | Metres while sprinting at near-maximal speed. |
| Standing Distance | m | Velocity band 1 under its plain-English name. |
| Walking Distance | m | Velocity band 2 under its plain-English name. |
| Jogging Distance | m | Velocity band 3 under its plain-English name. |
| Running Distance | m | Velocity band 4 under its plain-English name. |
| High Intensity Distance | m | Metres between the high-speed and sprint thresholds. |
12 metrics
Energy and accelerometer load metrics
Whole-body mechanical load and estimated energy cost, most of it derived from the accelerometer rather than from position.
| Metric | Unit | What it measures |
|---|---|---|
| Player Load | AU | Accumulated tri-axial acceleration change. Whole-body mechanical load, including non-running work. |
| Player Load Per Minute | AU/min | The rate at which Player Load accumulates. |
| Average Player Load | AU/min | Player Load per minute of session, read as an intensity. |
| Energy | kcal or J/kg | Estimated energy expended, derived from metabolic power. |
| Calories / Energy Expenditure | kcal | Estimated energy burned across the session. |
| Calories Per Minute | kcal/min | Estimated energy burned per minute. |
| High Metabolic Load Distance | m | Metres covered while metabolic power exceeds 25.5 W/kg. |
| HML Distance Per Minute | m/min | High metabolic load distance per minute of play. |
| HML Efforts | efforts | Separate efforts above the high metabolic load threshold. |
| Dynamic Stress Load | AU | Weighted total of impacts above 2 g, with harder impacts counting disproportionately. Proprietary to STATSports. |
| Total Acceleration Load | AU | Accumulated absolute acceleration and deceleration values across the session. |
| Average Acceleration Load | AU/min | Acceleration load per unit of time. |
6 metrics
Metabolic metrics
Energy cost expressed as power rather than distance, which is what catches hard work that never reaches high speed.
| Metric | Unit | What it measures |
|---|---|---|
| Metabolic Distance | m | Distance covered inside a defined metabolic power zone. |
| Equivalent Metabolic Distance | m | The distance at constant speed that would have cost the same energy. |
| Average Metabolic Power | W/kg | Average rate of energy use per kilogram of body mass. |
| High Metabolic Power Duration | s | Time spent above the high-metabolic-power threshold. |
| High Metabolic Power Time | % | Share of session time above that threshold. |
| Active Duration | s | Time in active movement rather than standing or passive recovery. |
2 metrics
Repeated high-intensity efforts
Whether hard efforts arrived spread out or stacked back to back with no time to recover.
| Metric | Unit | What it measures |
|---|---|---|
| RHIE Total Bouts | bouts | Clusters of repeated high-intensity efforts with minimal recovery between them. |
| RHIE Efforts Per Bout (Max) | efforts | The most high-intensity efforts packed into a single bout. |
5 metrics
Impact metrics
Collisions and hard foot strikes picked up by the accelerometer, sorted into g-force bands.
| Metric | Unit | What it measures |
|---|---|---|
| Impacts | count | Accelerometer-detected collisions above a set g-force threshold. |
| Low Impacts | count | Impacts in the lowest configured g-force band. |
| Medium Impacts | count | Impacts in the middle configured band. |
| High Impacts | count | Impacts in the highest configured band. |
| Max Impact | g | The single hardest impact recorded in the session. |
7 metrics
Movement and symmetry metrics
What the athlete's body was doing rather than how far it travelled: jumps, cuts, ball carries and left-right balance.
| Metric | Unit | What it measures |
|---|---|---|
| Step Balance | % | Left versus right step impact symmetry. An even athlete reads 50:50. |
| Running Imbalance | % | Average load difference between left and right legs while running. |
| Total Time | s (shown HH:MM:SS) | Total elapsed duration of the session or drill. |
| Jumps | count | Jumps detected from the unit's inertial sensors. |
| Changes of Direction | count | Sharp left or right cuts detected by the inertial sensors. |
| Dribbles | count | Ball-carry actions detected by the unit. Detection method is not publicly documented. |
| Dribble Distance | m | Distance travelled while carrying the ball. |
6 metrics
Work rate and ball metrics
One work-to-rest measure, plus the shot metrics that come from limb-mounted sensors rather than the vest unit.
| Metric | Unit | What it measures |
|---|---|---|
| Work/Rest Ratio | % | Share of session time spent moving above the work speed threshold. |
| Total Shots | count | All ball strikes detected, every power band. |
| Low Power Shots | count | Shots struck in the lowest power band. |
| Medium Power Shots | count | Shots struck in the middle power band. |
| High Power Shots | count | Shots struck in the highest power band. |
| Shot Power | km/h or m/s | Speed of the foot or ball at the moment of striking, from a limb-mounted sensor. |
6 metrics
Session load metrics
The group that turns everything above into a decision, by expressing a session against the athlete's own benchmark instead of as a raw count.
| Metric | Unit | What it measures |
|---|---|---|
| Session Volume | % | Session workload as a percentage of the athlete's own matchday benchmark. |
| Session Intensity | % | Session work rate against that benchmark, using per-minute metrics. |
| Speed Intensity Index | % | The speed-based share of session intensity. |
| Acceleration Intensity Index | % | The acceleration-based share of session intensity. |
| RPE | AU (0-10 or 6-20) | The athlete's own rating of how hard the session felt, on a fixed scale. |
| Session RPE / sRPE | AU | RPE multiplied by session duration in minutes. The standard internal load figure. |
14 metrics
Heart rate metrics
Cardiovascular response, available when athletes wear a heart rate strap alongside the GPS unit.
| Metric | Unit | What it measures |
|---|---|---|
| Max Heart Rate | bpm | The highest heart rate reached in the session. |
| Average Heart Rate | bpm | Mean heart rate across the whole session. |
| Max HR (% HRmax) | % | Session peak as a percentage of the athlete's maximum. |
| Average HR (% HRmax) | % | Session average as a percentage of the athlete's maximum. |
| Heart Rate Exertion | AU | Weighted cardiovascular load, where time at higher heart rates counts for more. |
| Red Zone Time | s or min | Time above the top threshold, 85% of max HR by default. |
| Heart Rate Band 1 Duration | s or min | Time in the lowest band, under 50% of max HR by default. |
| Heart Rate Band 2 Duration | s or min | Time at 50-60% of max HR. |
| Heart Rate Band 3 Duration | s or min | Time at 60-70% of max HR. |
| Heart Rate Band 4 Duration | s or min | Time at 70-85% of max HR. |
| Heart Rate Band 5 Duration | s or min | Time at 85-95% of max HR. |
| Heart Rate Band 6 Duration | s or min | Time above 95% of max HR. |
| Heart Rate Band 7 Duration | s or min | Second-highest band where an eight-band model is used. |
| Heart Rate Band 8 Duration | s or min | Top band where an eight-band model is used. |
In Fractall
Which of these Fractall reads
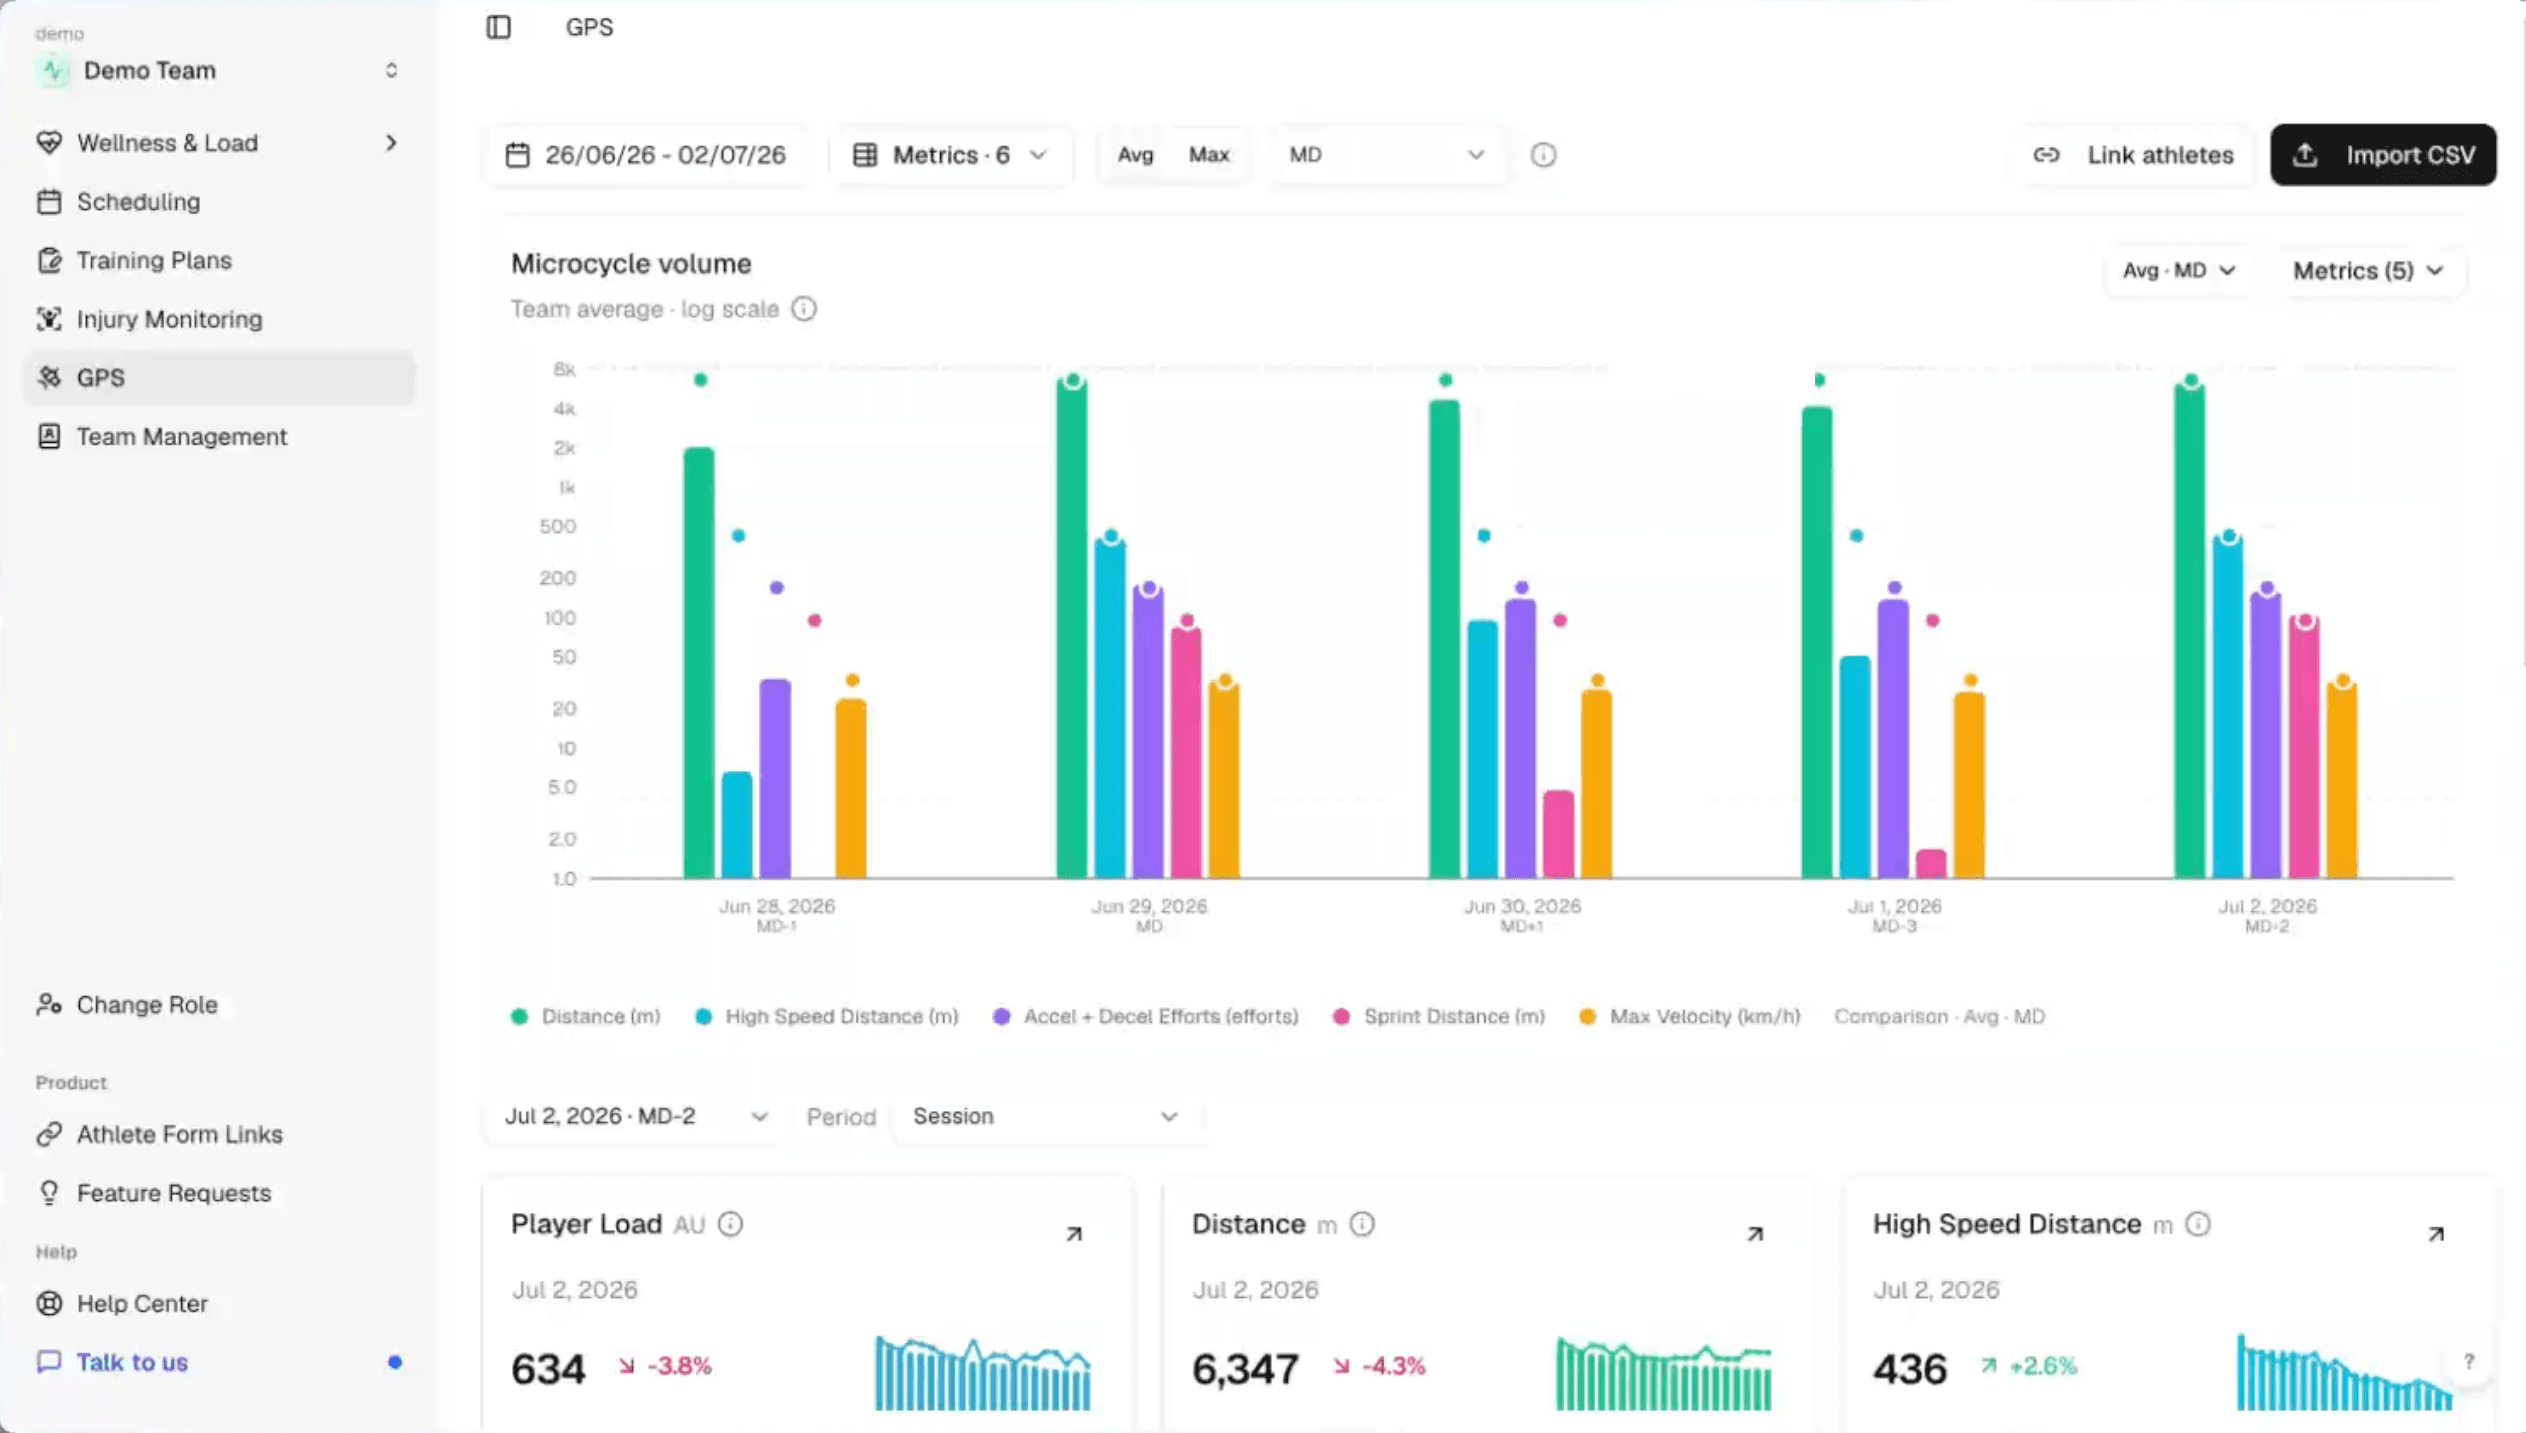
Fractall doesn't sell GPS units. It reads the export your provider already produces and turns these columns into charts beside the rest of the athlete's record.

Map a provider CSV first
Pick Catapult, StatSports, Oliver, or WIMU, bind the core columns, and read session KPIs for three athletes in the browser.
Import the export you already have
Drop your Catapult, STATSports, Oliver Sports or WIMU CSV into Fractall and chart the metrics that matter across the microcycle, beside RPE and wellness. One-month free trial, no card.
FAQs
Common questions about GPS metrics
What does AU mean in a GPS report?
What is the difference between high speed distance and sprint distance?
Why do two GPS systems report different numbers for the same session?
Which GPS metrics should a coach actually report?
Does a coach need GPS to monitor training load?
Related guides
Two Games a Week: What Wellness Data Shows Before Match 2
Fractall data on football teams playing two games a week: on match morning, fatigue sits less than half as far above normal. How to read wellness between games.
ChatGPT and Claude for Strength and Conditioning Coaches
What an S&C coach can ask ChatGPT or Claude about squad load, wellness and injuries, and the privacy settings to change before any athlete data goes in.
CMJ Test: Protocol, Norms and Why Devices Disagree
The same countermovement jump reads nearly 7 cm apart on a force plate, a phone app and a sensor. Triple the U16 to U18 gap. The protocol and the norms.