

1 Month Free Access (cancel anytime)
CMJPhysical testsPower testingTest norms

CMJ Test: Protocol, Norms and Why Devices Disagree

The same countermovement jump reads nearly 7 cm apart on a force plate, a phone app and a sensor. Triple the U16 to U18 gap. The protocol and the norms.

Published
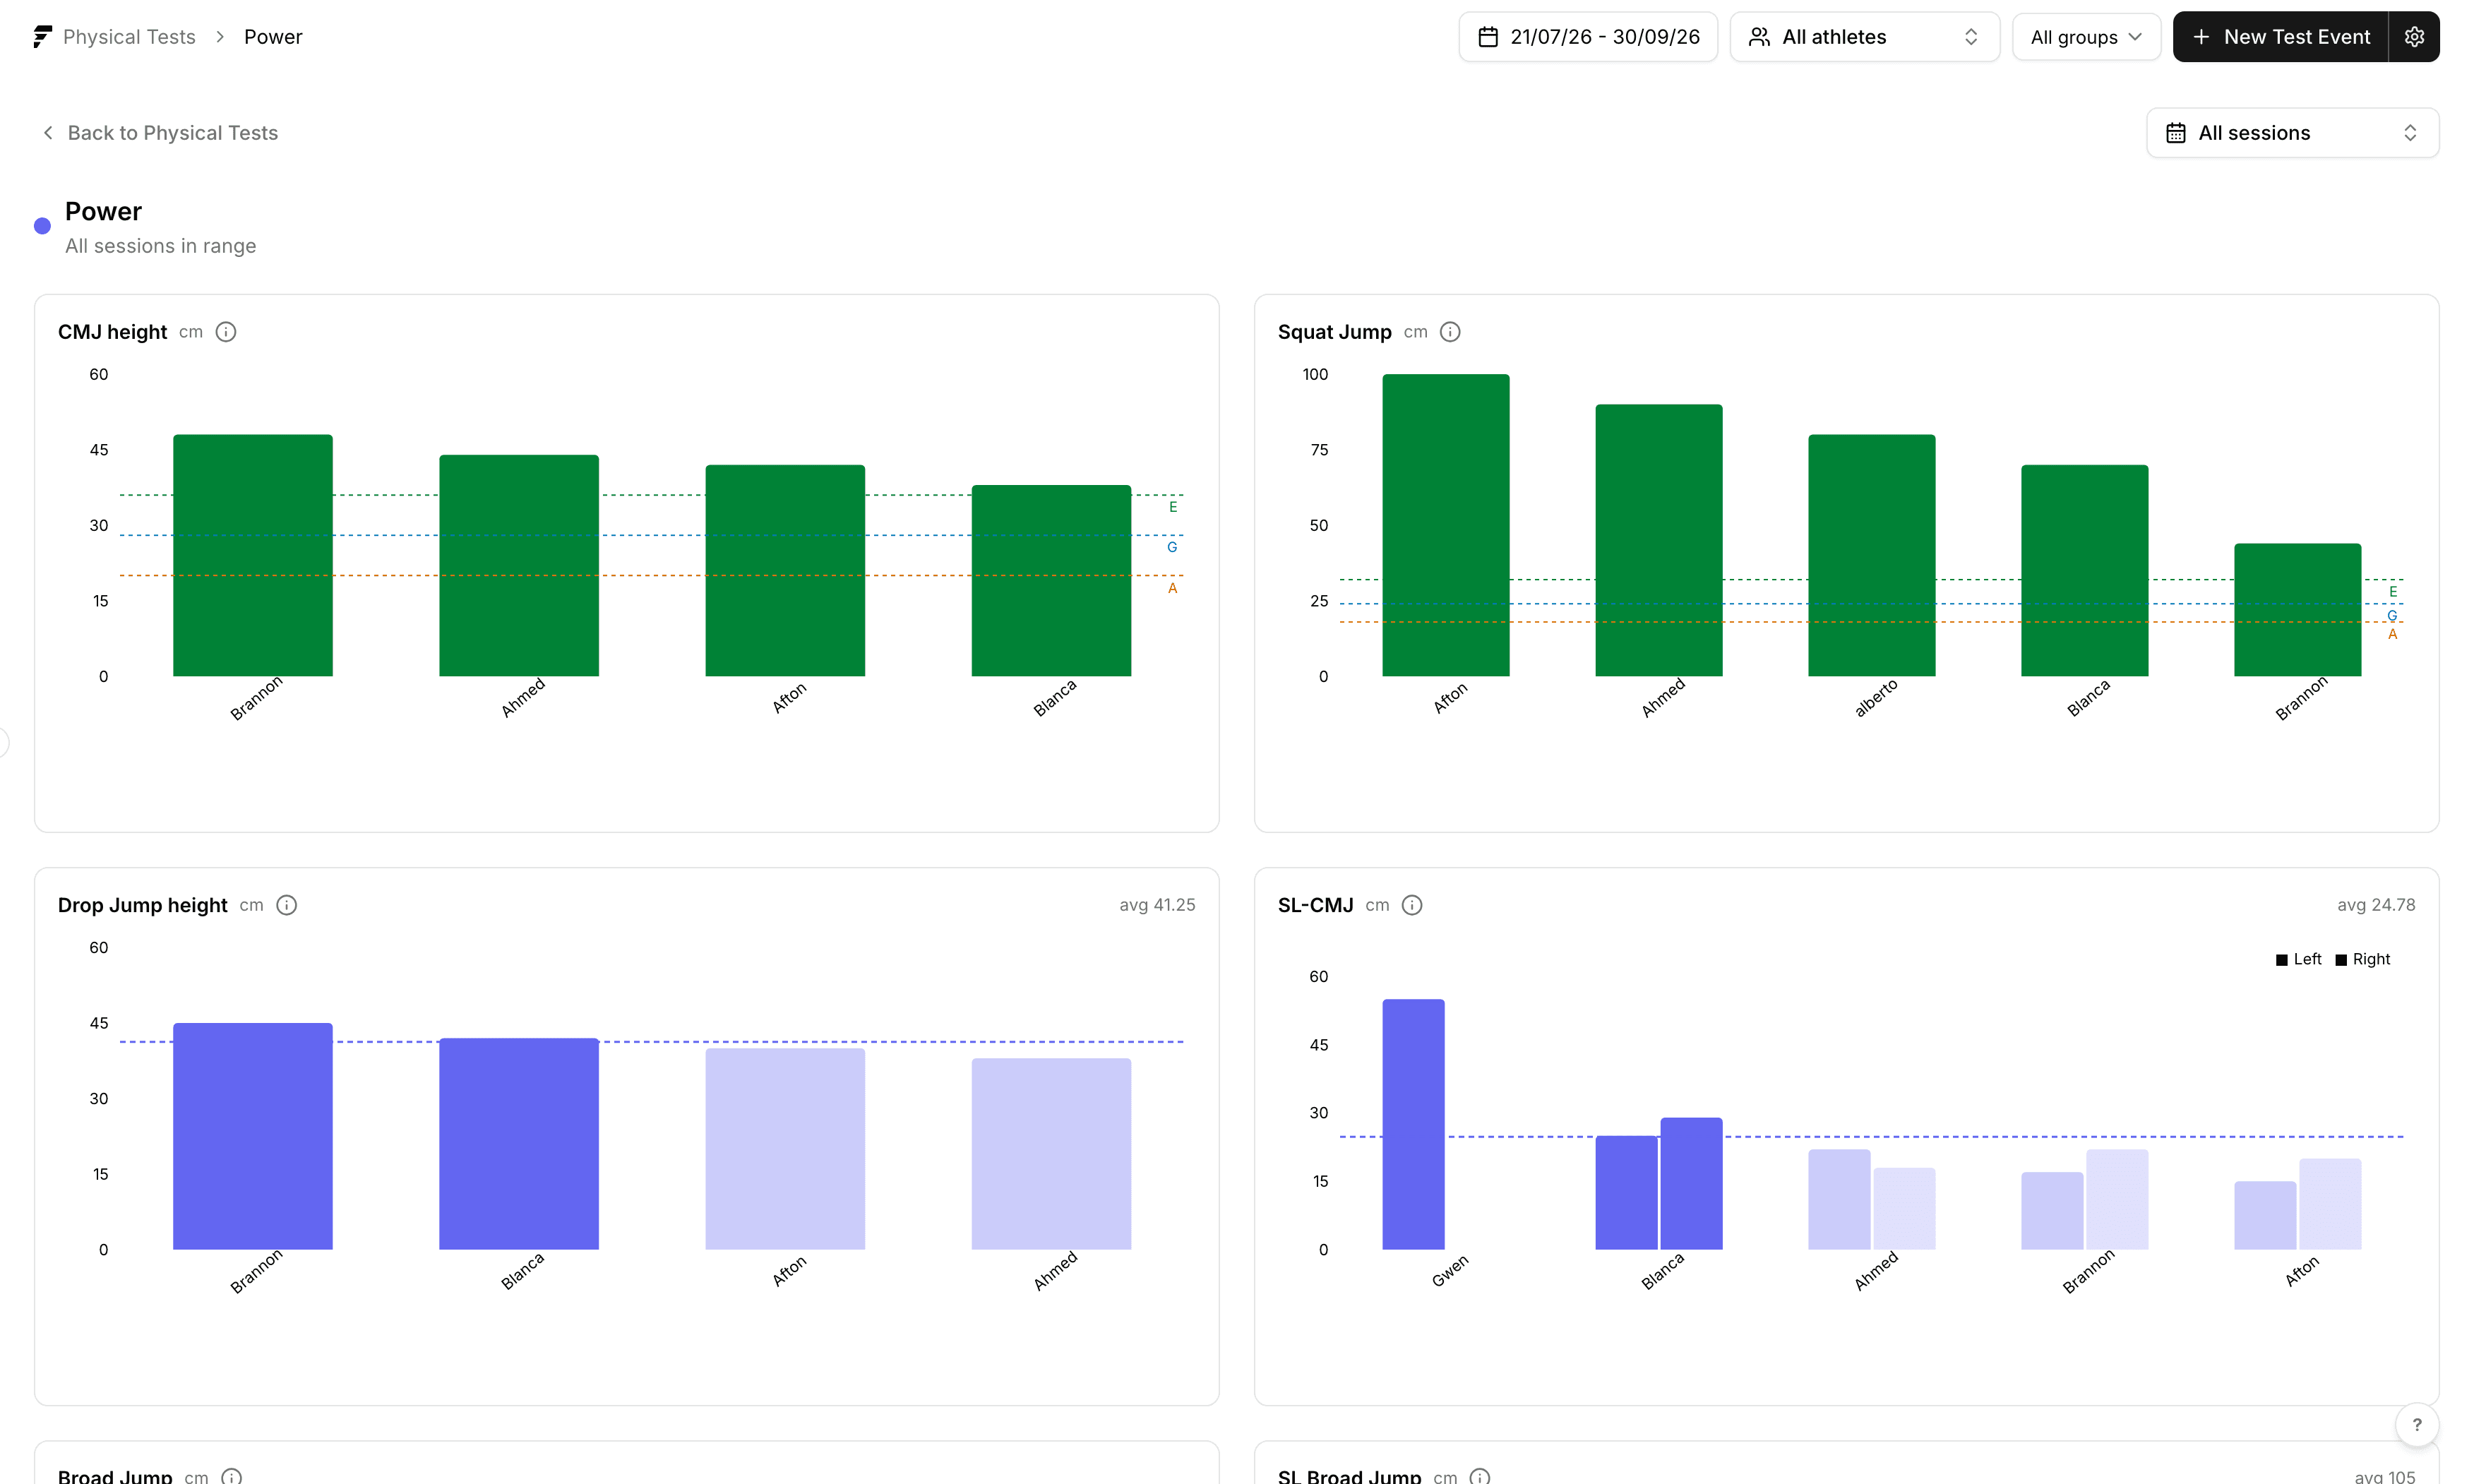
Fractall power test analysis showing CMJ height, squat jump, drop jump and single-leg CMJ bar charts for a squad, with dashed lines marking the excellent, good and average bands.

CMJ

The number is already wrong before the athlete jumps

The instrument you measure with moves jump height further than a year of training does.

Quick answer

The countermovement jump is a vertical jump that starts from standing, drops into a countermovement and comes straight back up. It measures lower-limb power through the stretch-shortening cycle. The practical problem is that the number depends on the device: on 20 professional volleyball players a phone app read 4.16 cm higher than a force plate and an inertial sensor read 2.59 cm lower. That is almost 7 cm between two readings of the same jump. Between the U16 and U18 means in elite football there are 2.3.
You tested the squad on the first day of pre-season. Twenty-two numbers on a sheet, the best at 41 cm and the worst at 28. You go looking for a reference table, you find one that puts elite males between 40 and 55 cm, and now you have twenty-one players below the line and an assistant asking what went wrong.
Probably nothing went wrong. Those bands circulate without saying which instrument produced them or which calculation method was used, and those are the two things that move the number most.

6.75 cm

Distance between the highest and lowest reading of the same jump

MyJump Lab 3 at +4.16 cm and the Baiobit inertial sensor at -2.59 cm against the same force plate, in the bilateral CMJ. 20 male professional volleyball players, mean age 17.85. Wilczyński et al., Frontiers in Physiology, 2026.

Petridis and colleagues measured 365 Hungarian elite junior footballers on a force plate. Between the U16 mean and the U18 mean there are 2.3 cm, from 36.3 to 38.6. Two years of growth and training are worth about a third of what the choice of device is worth.
That doesn't make the CMJ useless. It makes it a measure internal to your own squad rather than a yardstick against numbers produced somewhere else. The part you control is the consistency of the method, and that alone is enough to make the test worth running.

Flight time and impulse-momentum

The two ways of deriving the height of a jump. The first times how long the athlete stays in the air and infers height from it. The second integrates the force recorded by the plate to get take-off velocity.

Example: Asimakidis and colleagues found both methods inside the same review of elite football. Two studies can report the same number while measuring slightly different things, which is one reason the published range is so wide.

Wilczyński B, et al. Agreement and reliability of force-plate, smartphone-based, and wearable-sensor countermovement jump assessments for neuromuscular monitoring in male professional volleyball players. Frontiers in Physiology, 2026. Petridis L, Utczás K, Tróznai Z, Kalabiska I, Pálinkás G, Szabó T. Vertical Jump Performance in Hungarian Male Elite Junior Soccer Players. Research Quarterly for Exercise and Sport, 2019;90(2). Wilczyński's sample is 20 volleyball players, with effective analyses between 10 and 13 subjects: read the offsets as orders of magnitude in one population, not as constants that hold everywhere.

Reference values

Reference values, with the method next to them

Every row also says how it was produced. Without that column the table isn't usable.

Asimakidis and colleagues collected the test protocols used in elite male football. For the CMJ, team means for professionals run from 33.6 to 57.2 cm across 54 studies. In elite youth, from 34.8 to 58.6 cm across 33 studies.
Twenty-three centimetres between the lowest squad and the highest, and inside that spread sit different instruments, different calculation methods and different populations. Which is why the right-hand column matters as much as the middle one.
PopulationCMJ heightHow it was measured
Male professional football, team means pooled across 54 studies33.6 to 57.2 cmMixed instruments, two different calculation methods. Asimakidis et al., Sports Medicine, 2024
Male elite youth football, means pooled across 33 studies34.8 to 58.6 cmMixed instruments. Asimakidis et al., Sports Medicine, 2024
Hungarian elite junior football, U16 (part of the 365 tested)36.3 cmForce plate, hands on hips. Petridis et al., RQES, 2019
Hungarian elite junior football, U1737.5 cmForce plate, hands on hips. Petridis et al., RQES, 2019
Hungarian elite junior football, U1838.6 cmForce plate, hands on hips. Petridis et al., RQES, 2019
Male university students, hands on hips against free arms31 cm against 38 cmNot athletes: use for direction, not as a benchmark. Walsh et al., JSCR, 2007
Female university students, hands on hips against free arms22 cm against 27 cmNot athletes, same caveat. Walsh et al., JSCR, 2007

How to use this table

Find the row that resembles your instrument and your population, and use only that one. Measure with an app and compare against the force-plate rows and your squad will look better than it is. Measure with free arms and compare against hands-on-hips rows and it will look better twice.
Badby and colleagues published force-plate reference values in 2025 for 139 professionals and 137 youth players across seven English Football League clubs. The least expected result concerns the jump strategy metrics, meaning the way the jump is built: between professionals and youth the differences were negligible. What separated the two groups was output, not technique. On the isometric mid-thigh pull, peak force was 3031 N against 2441 N.
If you want the wider picture across a testing day rather than the jump on its own, the physical test norms guide covers the same method-first reading for sprint, aerobic and strength tests, and which tests are worth running at all is the question to settle before you buy anything.
Asimakidis ND, Bishop CJ, Beato M, Turner AN. Assessment of Strength and Power Capacities in Elite Male Soccer: A Systematic Review of Test Protocols Used in Practice and Research. Sports Medicine, 2024. Badby AJ, Comfort P, Ripley NJ, Mundy PD, Soriano MA, Robles-Palazón FJ, Fahey J, Sindall P, Bramah C, McMahon JJ. Normative data and objective benchmarks for selected force plate tests for professional and youth soccer players in the English Football League. Journal of Sports Sciences, 2025. Walsh MS, Böhm H, Butterfield MM, Santhosam J. Gender bias in the effects of arms and countermovement on jumping performance. Journal of Strength and Conditioning Research, 2007.

Execution

The protocol, step by step

Six decisions that make your squad's numbers comparable from one pre-season to the next.

The rule that matters more than the others

Standardise the variant, the surface, the warm-up and the instrument, then never change them. A CMJ that isn't comparable to your last CMJ has cost you a morning and told you nothing.
  1. 1

    Fix the variant and leave it alone

    Hands on hips if you want to read your numbers against the literature, free arms if you care about the game action. The choice matters less than how consistently you hold it.

  2. 2

    Start standing, let the athlete choose the depth

    The athlete decides how far down the countermovement goes. Imposing a knee angle changes the jump strategy and doesn't make the numbers more comparable.

  3. 3

    Extend hip, knee and ankle in flight

    Tucked legs stretch the flight time without raising the centre of mass. On any flight-time instrument the number goes up while the jump doesn't.

  4. 4

    Land where you took off

    Same spot, same posture. A strip of tape on the floor costs nothing and saves you half the jumps you'd otherwise throw away.

  5. 5

    Three attempts, full recovery, keep the best

    With genuine rest between them. If the third is the best of the three, give a fourth: it means the athlete hadn't finished warming up.

  6. 6

    Write the instrument next to the result

    Make, model and variant. It's the only way to know in six months whether a comparison holds.

On the first step, the literature has effectively already chosen for you. Of the elite male studies Asimakidis and colleagues reviewed, 99 fixed the hands on the hips, specifically to take the arm contribution out of the result. Free arms are the more sport-specific action and a defensible choice, but pick them and you give up the ability to read your squad against almost everything published.

What to keep identical between one testing session and the next

  • Same instrument as last time, same make and same model
  • Same variant, hands on hips or free arms
  • Same surface, the plate doesn't move from parquet to grass
  • Same point in the week and the same gap since the last hard session
  • Same warm-up, written down once and reused
  • Same operator, if you're collecting the data by hand

Comparison

CMJ, squat jump and what the gap between them says

Run on its own the CMJ gives you a height. Run next to a squat jump it gives you a reason.

The squat jump starts from a held squat position and isolates the concentric phase. The CMJ adds the countermovement, and with it the stretch-shortening cycle. Both sit in the same battery, which in parts of Europe still carries Carmelo Bosco's name alongside the drop jump and the free-arm CMJ.
The comparison between them is the informative part. The difference between a squat jump and a CMJ says how much of the athlete's elasticity is actually being used. In Petridis' 365 junior players the squat jump went from 32.9 to 33.9 cm between U16 and U18, one centimetre, while the CMJ went from 36.3 to 38.6, over two.
Two athletes can jump 38 cm in the CMJ and need opposite training. The one whose squat jump is 37 is getting almost nothing out of the countermovement. The one whose squat jump is 30 is relying on it heavily. Same number on the sheet, different problem.

Interpretation

When an improvement is real

Every instrument has a threshold below which you're reading its noise rather than the athlete.

2.79 cm

Minimal detectable change on a force plate, at 95% confidence

Between two sessions twelve days apart. The same study puts a phone app at 3.86 cm and an inertial sensor at 8.63 cm. Wilczyński et al., Frontiers in Physiology, 2026.

A squad that goes from a mean of 36.1 cm to 37.4 over a block has moved 1.3 cm. On a force plate that sits inside the measurement error. With an inertial sensor you would need more than 8 cm before you could say anything at all, which is close to four times the 2.3 cm that separates the U16 and U18 means in Petridis' sample.

What to look at instead of height alone

Petridis and colleagues found peak impulse, peak force and peak power more sensitive to changes in maturity status than jump height. If your instrument gives you those, track them. If it only gives you height, accept that you are working with a coarse measure and set your threshold accordingly.
This is also the argument for testing less often than instinct suggests. If the smallest change you can detect takes a training block to produce, testing every fortnight generates noise you will then be tempted to explain.

Equipment

Force plate, app or sensor

The three field options, and what each one costs you in accuracy rather than in money.

InstrumentOffset against the force plateRepeatability between sessions
Force plate (VALD)referenceCV 2.5%, minimal detectable change 2.79 cm
Phone app (MyJump Lab 3)reads 4.16 cm higher, limits of agreement -1.24 to 9.56 cmCV 3.1%, minimal detectable change 3.86 cm
Inertial sensor (Baiobit)reads 2.59 cm lower, limits of agreement -10.92 to 5.74 cmCV 8.3%, minimal detectable change 8.63 cm

If you're choosing today

A phone app is the pragmatic option for a club without a plate. It reads high, so your numbers won't line up with force-plate tables, but its repeatability is close enough to a plate to track your own squad. The inertial sensor in this study was the weakest on both counts. One study, one sample of volleyball players, so treat that as a signal rather than a verdict on a product category.
Whichever you pick, the number belongs somewhere it can be read next to everything else you collect. A jump height in a spreadsheet tab of its own is a number nobody looks at twice. A jump that drops the week an athlete's wellness scores fall and their session load spikes is telling you something the jump alone isn't.

In Fractall

Where the result ends up

Fractall doesn't measure the jump. It records what you measured and puts it next to load and wellness.

How a testing day gets recorded

1

Open a testing session and name the window, something like pre-season.

2

Enter the squad in one grid, athletes down the side and tests across the top. Single-leg CMJ takes a left and a right value on the same row.

3

Read each athlete against the squad average and against the bands for their sex, on a 0 to 100 score per test.
The CMJ sits in the power category alongside squat jump, drop jump, reactive strength index, single-leg CMJ and broad jump. The jump and power test catalogue lists what each one stores, and the physical testing feature page covers the six categories together.
Single-leg CMJ keeps the left and the right value on the same row rather than averaging them at entry, so an asymmetry stays in the record instead of disappearing into a mean. Raw values normalise to a 0 to 100 score per test, which is what lets a jump height and a broad jump distance sit on the same radar.
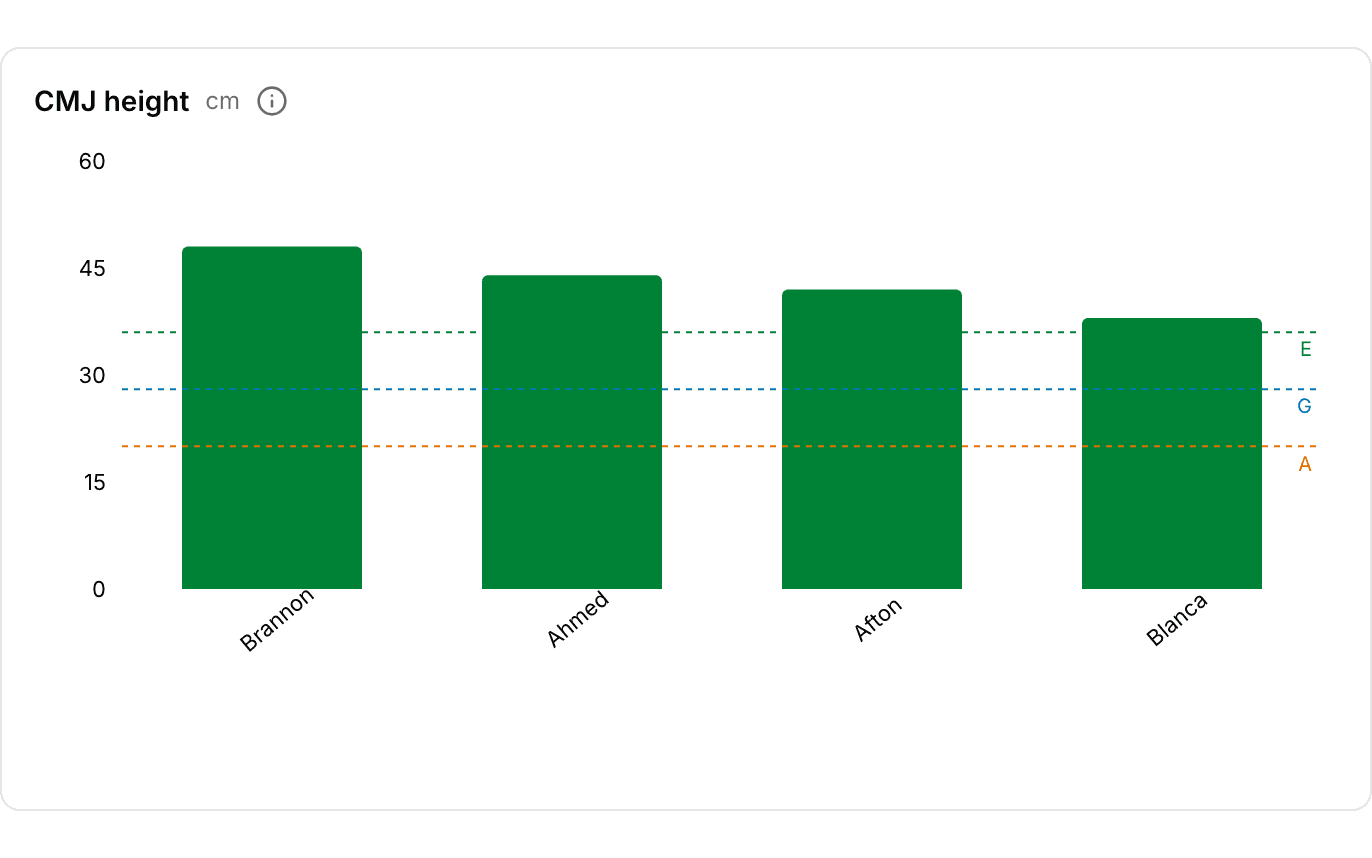
CMJ height bar chart in Fractall's power test analysis, showing four athletes' jump heights with dashed threshold lines marking the excellent, good and average bands.
Squad CMJ heights against the excellent, good and average thresholds. The dashed lines are the bands, and they are yours to move.
Those dashed lines come from a benchmark table you can edit. These are the defaults Fractall ships for CMJ height, and every one of them can be overridden per team and saved.
BandMale CMJ heightFemale CMJ height
Excellentabove 50 cmabove 36 cm
Good40 to 50 cm28 to 36 cm
Average30 to 40 cm20 to 28 cm
Poorbelow 30 cmbelow 20 cm

This is where the instrument problem gets handled

Fractall's default male "excellent" threshold is 50 cm. Every senior team mean Petridis recorded sits in the thirties, and 50 cm is near the top of the 33.6 to 57.2 cm range Asimakidis pooled. Measure on a phone app that reads about 4 cm high and you will band players generously against a threshold that was already demanding. Rather than mentally correcting every reading, move the thresholds once to match the device you actually use, and let the bands do the work afterwards.

What it doesn't do yet

The dashboard shows the latest result per test, not a progress line, and you can't yet diff one testing session against another. Entry is coach-side on the web, with no athlete self-entry, and test results aren't part of the daily, weekly or athlete exports. Comparing two testing dates is still a manual job.
The same method-first reading applies to the aerobic side of a testing day. The Bronco test guide walks through why published squad times disagree by up to 59 seconds, for much the same reason CMJ tables disagree by 23 centimetres.

Put the testing day next to load and wellness

Record a CMJ session for the whole squad in one grid, then read it against the training load and wellness you're already collecting. No hardware to buy.

Start a free trial

FAQs

Frequently asked questions

The questions coaches ask when a CMJ number doesn't match the table they found.

What is a good CMJ score for a footballer?

It depends on how you measured it before it depends on who jumped. Asimakidis and colleagues pooled team means for male professionals across 54 studies in 2024 and found values from 33.6 to 57.2 cm. Across 33 elite youth studies the range was 34.8 to 58.6 cm. That's more than 23 cm wide in both cases, and the studies inside it use two different calculation methods. A number pulled off a table without knowing which device produced it won't tell you whether your squad jumps well.

Should the CMJ be done with hands on hips or with arm swing?

Hands on hips, if you want to compare against the literature. In Asimakidis' 2024 review, 99 studies on elite males fixed the hands on the hips specifically to remove the arm contribution. Walsh and colleagues measured that contribution in 50 university students: 31 cm hands on hips against 38 cm with arm swing in men, 22 against 27 cm in women. Those are students rather than athletes, so take the direction and the order of magnitude, not the exact figures. The working rule is that whichever variant you pick, you keep it forever.

Is a phone app as reliable as a force plate for CMJ?

It's repeatable, but it reads high. Wilczyński and colleagues compared a VALD force plate, the MyJump Lab 3 app and a Baiobit inertial sensor on 20 professional volleyball players. In the bilateral CMJ the app overestimated the plate by 4.16 cm on average and the sensor underestimated it by 2.59 cm. On repeatability the app holds up: a coefficient of variation of 3.1% against the plate's 2.5%, while the sensor reached 8.3%. An app is fine for tracking your own squad over time. It isn't fine for comparing that squad against a table produced on a force plate.

How much does a CMJ need to improve before the change is real?

Roughly 2.8 cm on a force plate and roughly 3.9 cm with an app. In Wilczyński's study the minimal detectable change at 95% confidence between two sessions twelve days apart was 2.79 cm for the VALD plate and 3.86 cm for MyJump Lab 3, with the inertial sensor at 8.63 cm. Below that threshold you're reading the noise of the instrument. The sample is 20 volleyball players with a mean age of 17.85, so treat these as orders of magnitude rather than constants.

What is the difference between the CMJ and the squat jump?

The squat jump starts from a held squat and isolates the concentric phase. The CMJ adds the countermovement, which brings the stretch-shortening cycle into it. Comparing the two is the informative part: the difference between them says how much of the athlete's elasticity is being used. In Petridis' 365 elite junior players the squat jump went from 32.9 to 33.9 cm between U16 and U18 while the CMJ went from 36.3 to 38.6 cm. Both tests sit in the same battery, which in some countries still carries Carmelo Bosco's name alongside the drop jump and the free-arm CMJ.

Is jump height the best metric for tracking a young athlete?

Not on its own. Petridis and colleagues measured 365 Hungarian elite junior footballers on a force plate and concluded that peak impulse, peak force and peak power were more sensitive to changes in maturity status than height alone. The reason is arithmetic: there are 2.3 cm between the U16 mean and the U18 mean, a margin that sits inside the measurement error of plenty of field instruments.

Does Fractall compare one testing session against another?

Not yet. The physical testing dashboard shows the latest result per test rather than a progress line, and there's currently no diff between one testing session and the next. What you do get is bulk grid entry for the whole squad, a 0 to 100 score per test, bands from excellent through poor with separate thresholds by sex, and each athlete against the squad average. The band thresholds are editable per team, which is how you stop a device that reads high from flattering your squad: the CMJ defaults are 50 cm for excellent in men and 36 cm in women, and you can move them. Comparing two dates is still a manual job.

Related guides