4 Weeks Free Access (cancel anytime)
Interactive GuidePhysical testingBenchmarksFootball

Physical Test Norms for Strength and Conditioning Coaches

Published physical test norms for senior football, with the population and protocol behind every number, so you can tell a real change from test-day noise.

Published

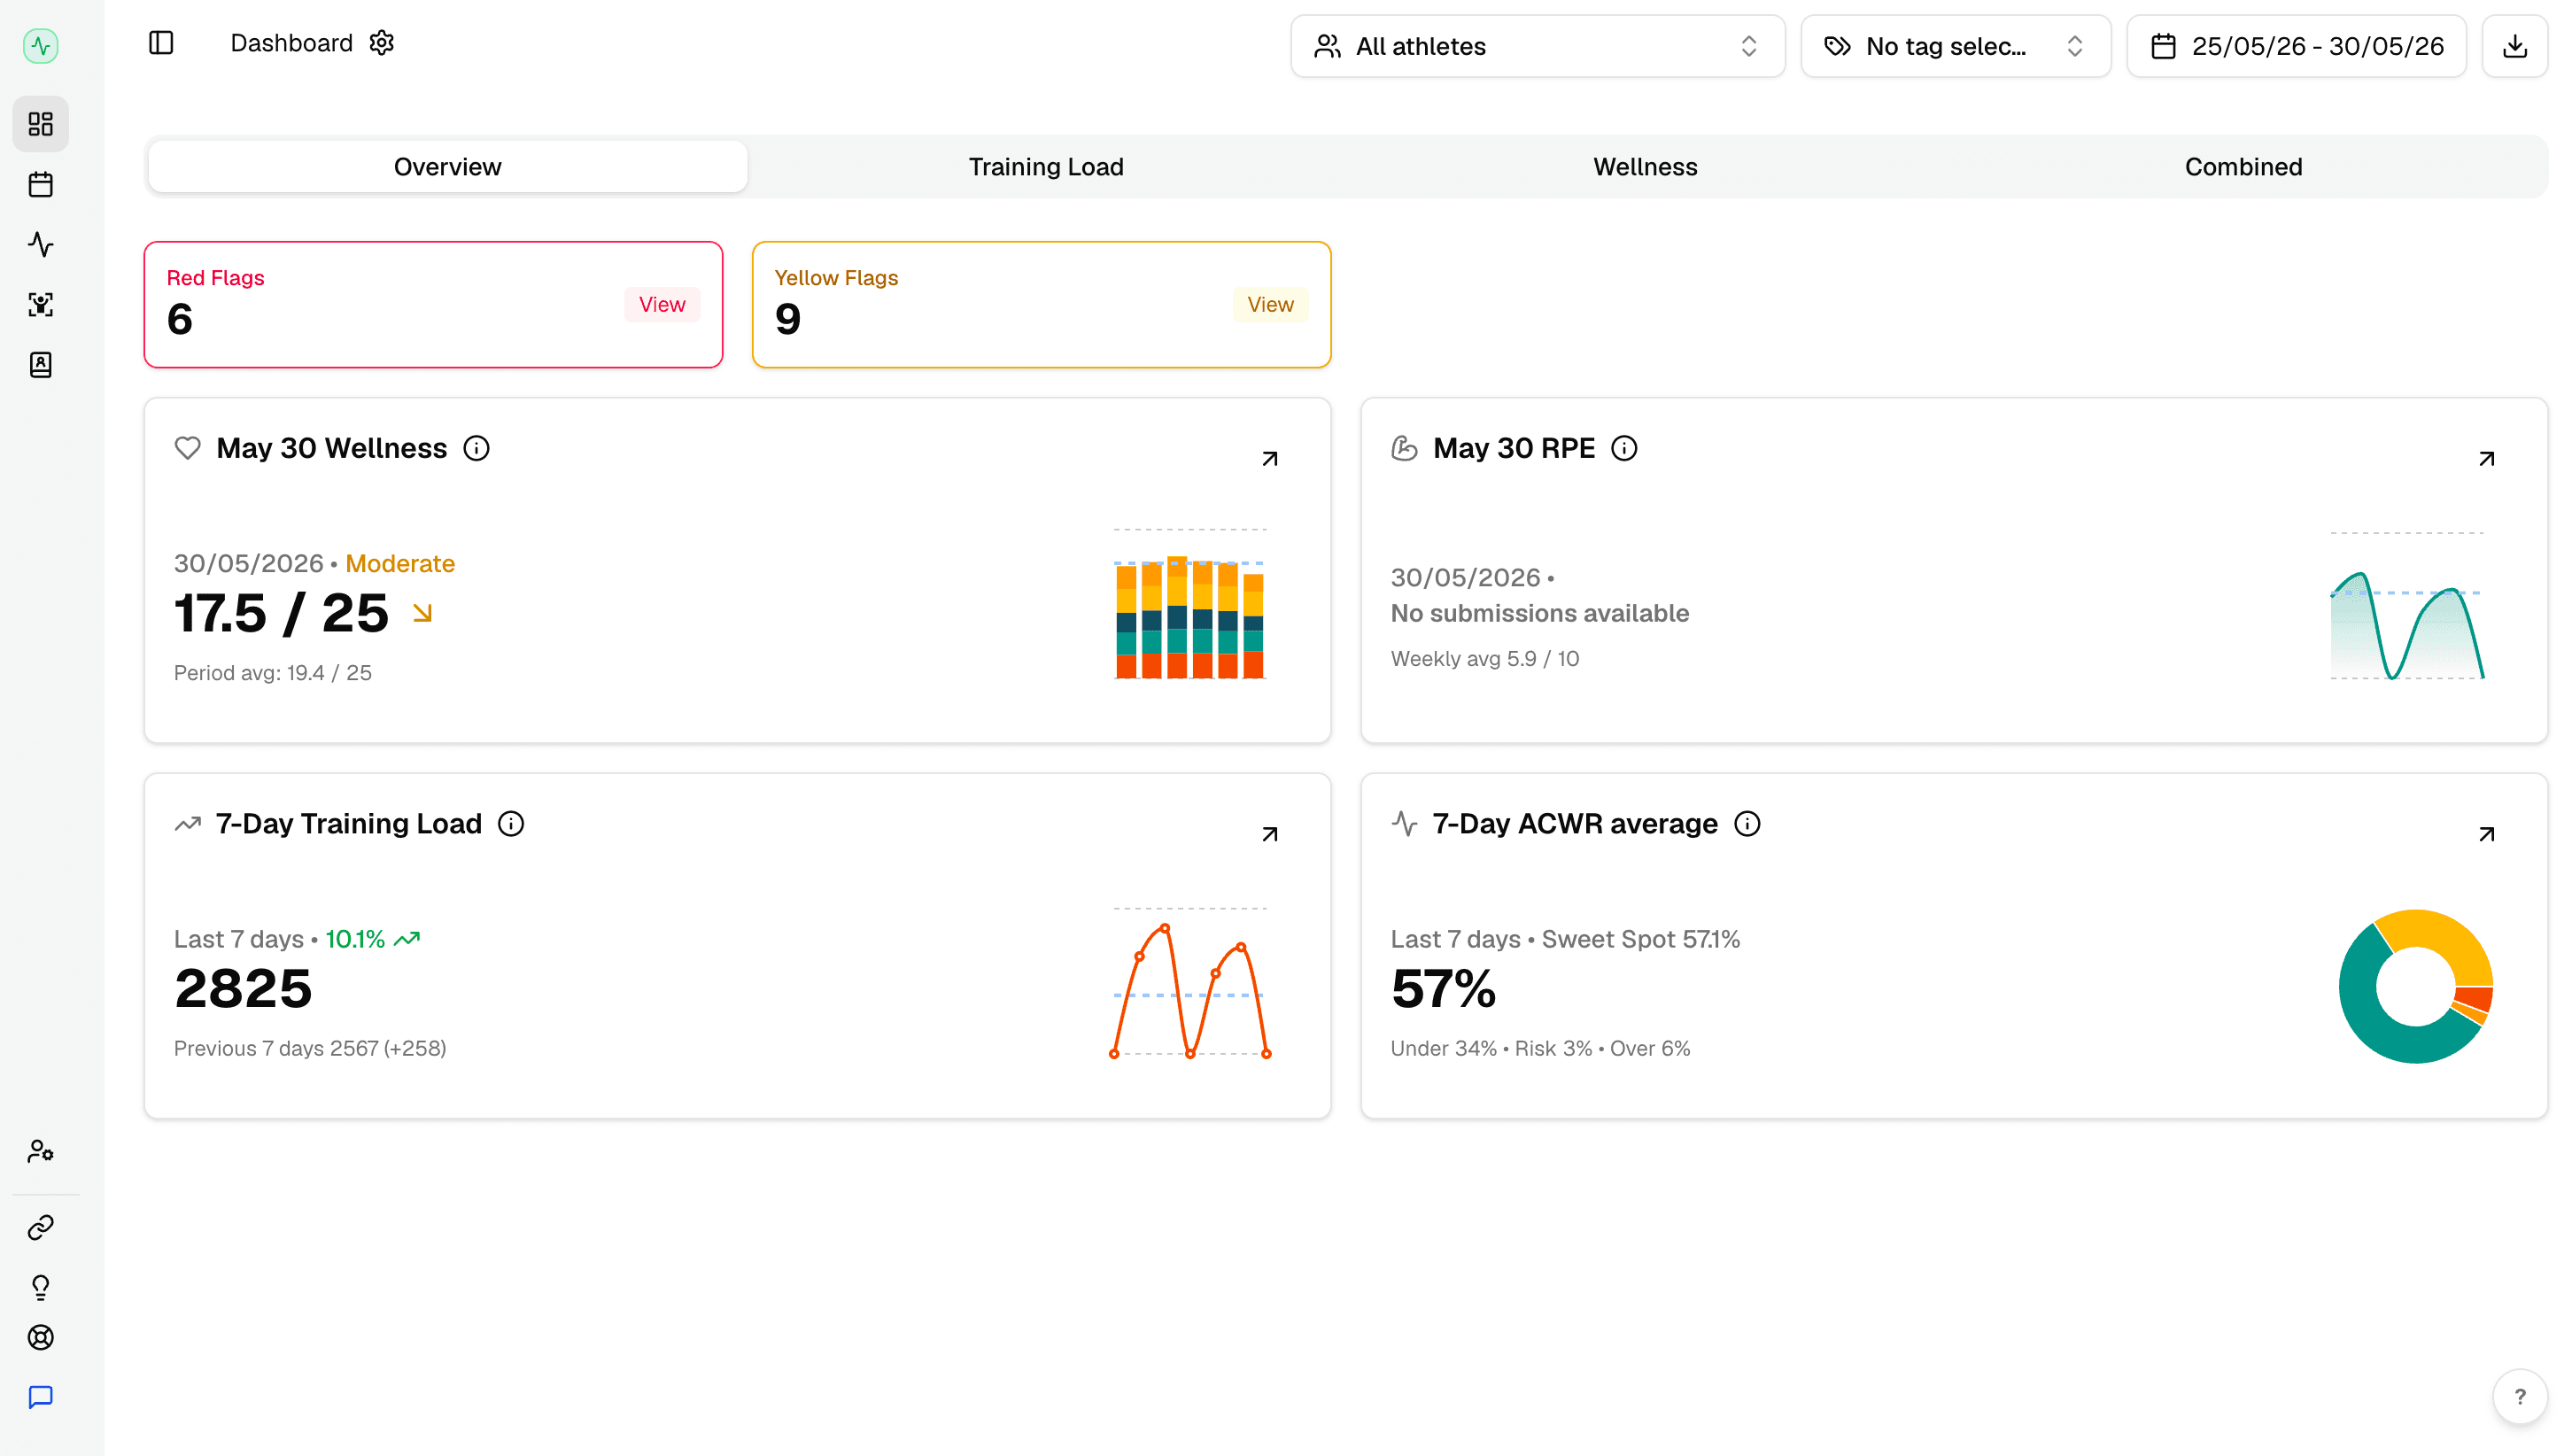
Fractall coach overview dashboard showing squad training load and wellness at a glance, where physical test results are stored alongside the rest of an athlete's history.

Physical test norms

Why published test norms disagree: protocol, not ability

Two published figures for senior women's countermovement jump sit 11.6 cm apart. Neither squad jumps higher than the other.

Quick answer

Senior male professionals in the Portuguese LigaPro average 37.2 cm on a countermovement jump, 1.57 s over 10 m and 4.55 s over 30 m. Every benchmark on this page carries the squad it came from and the protocol it was collected under, because protocol moves these numbers more than training does. Elite senior women jump 35.0 cm with hands on hips and 46.6 cm with an arm swing. That's an 11.6 cm gap created by where the players put their hands.
You ran the tests. You've got a spreadsheet of jump heights and sprint times, and one question you can't answer: are these any good? So you search for norms, find a table, and your squad comes out looking either worrying or suspiciously excellent.
Both readings are usually wrong, because most published norms tables don't say who was tested or how. The clearest example in the literature is the countermovement jump in senior women's football. A Danish top-league squad averaged 35.0 cm. A Northern Premier Division squad averaged 46.6 cm. The second group didn't jump 33% higher. They were allowed to swing their arms.

Why the arm swing matters this much

An arm swing adds upward momentum at take-off, so the same legs produce a higher jump. It is a different test. The legs did the same work. Comparing a hands-on-hips squad against an arm-swing benchmark makes a well-conditioned group look weak, and the reverse makes a weak group look fine.

Example: Your squad tests at 34 cm with hands on hips. Against the Danish figure they are normal. Against the Northern Premier figure they look 12 cm short, and you spend a block chasing a deficit that doesn't exist.

So every table below has three columns and none of them are optional: the test with its protocol, the published value, and the squad it came from. Where a paper doesn't state its protocol, the row says so rather than guessing. That happens more often than it should, including in the best senior football sample we could find.
This is the depth layer under our guide to which physical tests are worth running at a small club. That one helps you choose a battery. This one tells you what the numbers mean once you have them.

Power

Jump norms: countermovement and squat jump

Senior male professionals sit around 37 cm on a countermovement jump. The female figures depend entirely on arm position.

A countermovement jump measures how much force an athlete can produce quickly through the legs and hips. It's the most common test in football because it needs almost nothing, it takes under a minute per player, and it drops measurably when someone is fatigued.
Test and protocolPublished valuePopulation and source
Countermovement jump. Arm protocol not stated in the paper37.2 ± 5.5 cm33 male professionals, Portuguese LigaPro, age 26.4 ± 4.8. Barrera et al., Biology of Sport, 2023
Squat jump. Arm protocol not stated in the paper36.0 ± 4.4 cmSame squad and paper as the row above
Countermovement jump, hands on hips35.0 ± 1.0 cm23 women, Danish top league. Collated in Turner, Munro and Comfort, Strength and Conditioning Journal, 2013
Countermovement jump, with arm swing46.6 ± 4.8 cm36 women, Northern Premier Division. Collated in the same 2013 review
Male values: Barrera J, Figueiredo AJ, Duarte J, Field A, Sarmento H. Predictors of linear sprint performance in professional football players. Biology of Sport, 2023;40(2):359-364. Female values collated in Turner E, Munro A, Comfort P. Female Soccer: Part 1, A Needs Analysis. Strength and Conditioning Journal, 2013;35(1):51-57.
Read the male rows with the caveat attached. Barrera and colleagues report jump heights but not whether players kept their hands on their hips, so 37.2 cm can't be compared cleanly against either female figure. It's still the most useful senior benchmark we found, because the squad is professional, senior, and playing in the Portuguese second division, which is close to the level a lot of clubs actually operate at.
The standard deviations do more work than the means. At 37.2 ± 5.5 cm, roughly two thirds of that professional squad fell between 31.7 and 42.7 cm. An 11 cm spread inside one professional dressing room should end any conversation about a single target number for a squad. Fractall's physical testing feature stores countermovement jump, squat jump and reactive strength index per athlete for this reason: compare a player against their own history, with the squad spread as context.

Speed

Sprint norms: 10 m and 30 m

Professional men average 1.57 s over 10 m and 4.55 s over 30 m. The clearest female sample published speeds rather than times.

Test and protocolPublished valuePopulation and source
10 m sprint. Timing method not stated in the accessible text1.57 ± 0.13 s33 male professionals, Portuguese LigaPro. Barrera et al., Biology of Sport, 2023
30 m sprint. Timing method not stated in the accessible text4.55 ± 0.24 sSame squad and paper as the row above
20 m sprint without the ball, reported as mean speed22.39 ± 0.80 km/h33 professional women, Brazilian first division, age 23.5 ± 5.7. Preissler et al., Scientific Reports, 2023
20 m sprint carrying the ball, reported as mean speed20.37 ± 1.11 km/hSame squad and paper as the 20 m row above
Male values: Barrera et al., Biology of Sport, 2023;40(2):359-364. Female values: Preissler AAB, Schons P, Clemente FM, et al. Correlations between linear sprint with the ball, linear sprint without the ball, and change-of-direction without the ball in professional female soccer players. Scientific Reports, 2023;13:39.

Two conversions that are ours, not the authors’

Preissler and colleagues report 22.39 km/h as a mean speed over 20 m. That works out to about 3.22 s for the 20 m, but they never print that number, so treat it as our arithmetic rather than their finding. The same applies to the Bronco figure further down. Where we convert a published unit, we say so.
We've left out Barrera's 20 m value deliberately. The paper reports 2.99 s with a standard deviation of 0.03 s, which can't be right beside a 10 m standard deviation of 0.13 s. A squad cannot be four times more variable over 10 m than over 20 m. It's most likely a typesetting error, and a number we can't explain doesn't belong in a benchmark table.
The thing that will distort your own sprint numbers most is timing. Hand timing starts when the tester reacts and stops when they react again, which typically reads faster than electronic gates by enough to matter over 10 m. If you time by hand, your squad will look quicker than these professionals and it will mean nothing. Track your own trend instead, and treat the published figures as a rough level check. Fractall's speed and agility testing covers the 30 m sprint and the T-Test with the same method recorded each time, which is what makes a season's worth of times comparable to each other.

Change of direction

T-Test and 5-0-5 norms

The T-Test has a recent football sample split by sex: 10.06 s for men and 11.27 s for women. The 5-0-5 does not, at least not publicly.

Test and protocolPublished valuePopulation and source
Agility T-TestMen 10.06 ± 0.87 s, women 11.27 ± 0.84 s138 footballers, 69 men and 69 women, age 18 to 25. Chattanta, Verma and Mehra, Physical Therapy in Sport, 2024
Illinois agility testMen 15.56 ± 0.80 s, women 17.75 ± 1.37 sSame 138 footballers and the same 2024 paper
Chattanta V, Verma N, Mehra P. Quantifying the difference between male and female agility in football players: a cross-sectional study. Physical Therapy in Sport, 2024;70:90-94. Sample was 138 football players aged 18 to 25; the paper establishes reference values by sex and playing position.
This is the cleanest sex-split benchmark on the page, because both figures come from one sample tested one way. Two caveats. The players are 18 to 25 and the competitive level isn't specified as elite, so this is a footballer benchmark rather than a professional one. And the authors note goalkeepers scored lower in both sexes, which is worth remembering before you flag your keeper as a problem.
The 5-0-5 is the better-known test and the harder one to benchmark honestly. Ryan and colleagues pooled 5-0-5 results from 50 studies across 11 sports in 2025 and found men averaged 6.03% faster than women, and elite men 7.78% faster than subelite and novice men. Their football-specific absolute values sit behind a paywall we didn't get through, so we're giving you the relative findings and no table.
You'll find 5-0-5 bands elsewhere claiming under 2.30 s is elite for men and under 2.60 s for women. Those come from general-athlete reference tables, not from a named football sample. They're a rough sanity check and nothing more, so don't build a testing decision on them.

Aerobic

Bronco and Yo-Yo IR1 norms

An English Premier League squad averaged 4.65 m/s across the 1200 m shuttle. Yo-Yo IR1 reference distances run from 1810 m to 2420 m for men.

Test and protocolPublished valuePopulation and source
Bronco, the 1200 m shuttle. Reported as average velocity, not time4.65 ± 0.20 m/s21 male professionals at an English Premier League club, age 29.8 ± 3.4. Kavanagh et al., Biology of Sport, 2024
Yo-Yo IR1, international levelAround 2420 mMale soccer players. Bangsbo, Iaia and Krustrup, Sports Medicine, 2008
Yo-Yo IR1, elite levelAround 2190 mMale soccer players, same 2008 review
Yo-Yo IR1, moderately trainedAround 1810 mMale soccer players, in the same 2008 review
Bronco value: Kavanagh R, Matteotti M, Oliveira R, et al. The relationship between the 1200 m shuttle test and 40 m sprint test performance and distances covered in English Premier League matches. Biology of Sport, 2024;42(2):105-111. Yo-Yo IR1 values: Bangsbo J, Iaia FM, Krustrup P. The Yo-Yo intermittent recovery test. Sports Medicine, 2008;38(1):37-51.
The Bronco has moved from rugby into football pre-seasons, and the EPL figure is the most relevant senior football value we could source. Kavanagh and colleagues report average velocity rather than a finishing time. At 4.65 m/s, 1200 m takes about 4 minutes 18 seconds, though that conversion is ours. Standards you'll find elsewhere for the Bronco are mostly rugby standards, and rugby forwards carry a lot more mass, so they read slower than a football squad should.
On the Yo-Yo IR1, we've given male values only, and that gap is deliberate. Female reference distances of roughly 1600 m, 1360 m and 1160 m for international, elite and sub-elite circulate widely, but every trail we followed led to secondary reporting rather than the primary paper. We couldn't verify them, so they're not in the table. Use them as a loose orientation if you use them at all.
Both tests run to exhaustion, which makes them the two least repeatable things on this page. Motivation, pitch surface, temperature and where the test sits in the week all move the result. Run them at the same point in the cycle every time. If you're building a testing calendar, our six-week pre-season monitoring plan shows where an aerobic test fits without wrecking the week around it. Fractall's aerobic testing records the Bronco against each athlete's history.

Interpretation

Is the change real, or is it the test?

Every test has an error band. A change smaller than that band is measurement noise, and reacting to it wastes a training block.

Retest the same player twice in a week with nothing changed in between and you won't get the same number. The gap between those two scores is the test's typical error, and it sets the floor for what counts as a real change.

Typical error

The variation you get from repeating a test on an unchanged athlete. Published as a percentage of the score. Any change smaller than it tells you about the test, not the player.

Example: Typical error for the modified 505 ran between 2.0 and 3.2% in elite youth footballers. On a 2.50 s baseline that is roughly 0.05 to 0.08 s, so a player going from 2.50 s to 2.47 s has not improved.

That 505 figure comes from an elite youth sample, so treat it as an order of magnitude rather than your number. The reliable way to get your own is to build it: test twice inside a week, early in a block when nothing is changing fast, and look at the spread. It costs one extra test day a season and it stops you chasing noise for the rest of it.
The same logic applies to reading these tables. A single test score against a published mean tells you roughly which level a player sits at. It doesn't tell you whether they're getting better, and that second question is the one your training actually answers.

In Fractall

Where the results live after test day

Testing is rarely the gap at a small club. Keeping the results somewhere they can be compared next time usually is.

Most clubs run tests. Far fewer can pull up what a player scored eight months ago, under which protocol, next to the load they were carrying that week. That's the part a spreadsheet loses, one renamed tab at a time.

How Physical Tests works

1

Record the battery per athlete: countermovement jump, squat jump, reactive strength index, 30 m sprint, T-Test, Bronco, 1RM estimates, mobility screens and anthropometrics.

2

Each result lands on the athlete's own history, so the comparison is against their last test rather than against a stranger's published mean.

3

Test scores sit beside that athlete's training load and wellness, which is where a drop in jump height stops being a mystery.

A centre-back losing 3 cm on their jump means one thing in isolation and something else next to a week of poor sleep scores, so the results sit on the same athlete record as daily wellness tracking.
This doesn't make your stopwatch as accurate as timing gates. Fractall records what you measure and keeps it comparable over time. If you want to compare against gate-timed published samples, you need gates. If you want to know whether your centre-back is jumping higher than in January, you need a consistent protocol and somewhere to put the numbers. The sites publishing the biggest norms tables tend to sell force plates. Four of the tests on this page need cones, a tape measure and a stopwatch.

Keep test results you can still read next season

Fractall stores every physical test against the athlete's own history, next to their load and wellness. No hardware needed, and the first 4 weeks are free.

Start free trial

FAQs

Frequently asked questions

The questions coaches ask when a test score doesn't match the benchmark they found.

What is a good countermovement jump height for a footballer?

In the clearest senior sample we could source, 33 male professionals in the Portuguese LigaPro averaged 37.2 cm with a standard deviation of 5.5 cm. For senior women, a Danish top-league squad averaged 35.0 cm with hands on hips, while a Northern Premier Division squad averaged 46.6 cm using an arm swing. Those two female figures are 11.6 cm apart because of the arm protocol, not because one squad jumps higher, which is why the number alone tells you nothing without the protocol beside it.

What is a good 30 m sprint time for a football player?

33 male professionals in the Portuguese LigaPro averaged 4.55 seconds over 30 m, with a standard deviation of 0.24 seconds, and 1.57 seconds over 10 m. Compare against that only if your timing method matches theirs. Hand timing typically reads faster than gates, so a stopwatch squad that looks quick against a gate-timed benchmark is usually measuring the tester's reaction, not the player.

Why do published jump and sprint norms disagree so much?

Three reasons, in order of size. Arm position on a jump changes the result by more than a decade of training does. Timing equipment differs, with hand timing reading faster than electronic gates. And the samples differ in level, age and sex while often being labelled the same way. Without a stated population and protocol, you have a number and no way to use it.

How much does a test score have to change before it matters?

More than the test's own error. For the modified 505, typical error in elite youth footballers ran between 2.0 and 3.2 percent, so a change of about 1 percent is noise. Establish your own error by testing the same players twice in a week with nothing changed in between, then treat any change smaller than that spread as a measurement artefact rather than a training effect.

Do you need force plates or timing gates to test usefully?

No. Four of the tests here run on cones, a tape measure and a stopwatch. Consistency matters more than precision for tracking change in one squad, because a repeatable method makes your own history comparable even when it is not comparable to a published gate-timed sample. Precision matters when you want to compare against outside benchmarks.

Related guides