4 Weeks Free Access (cancel anytime)
Interactive GuidePhysical testsAerobic testingTest norms

Yo-Yo IR1 Test: Protocol, Score Table, VO2max and Norms

The rating table most coaches grade against came out of a formula, not a squad. The protocol, the full level table, and norms that name their population.

Published
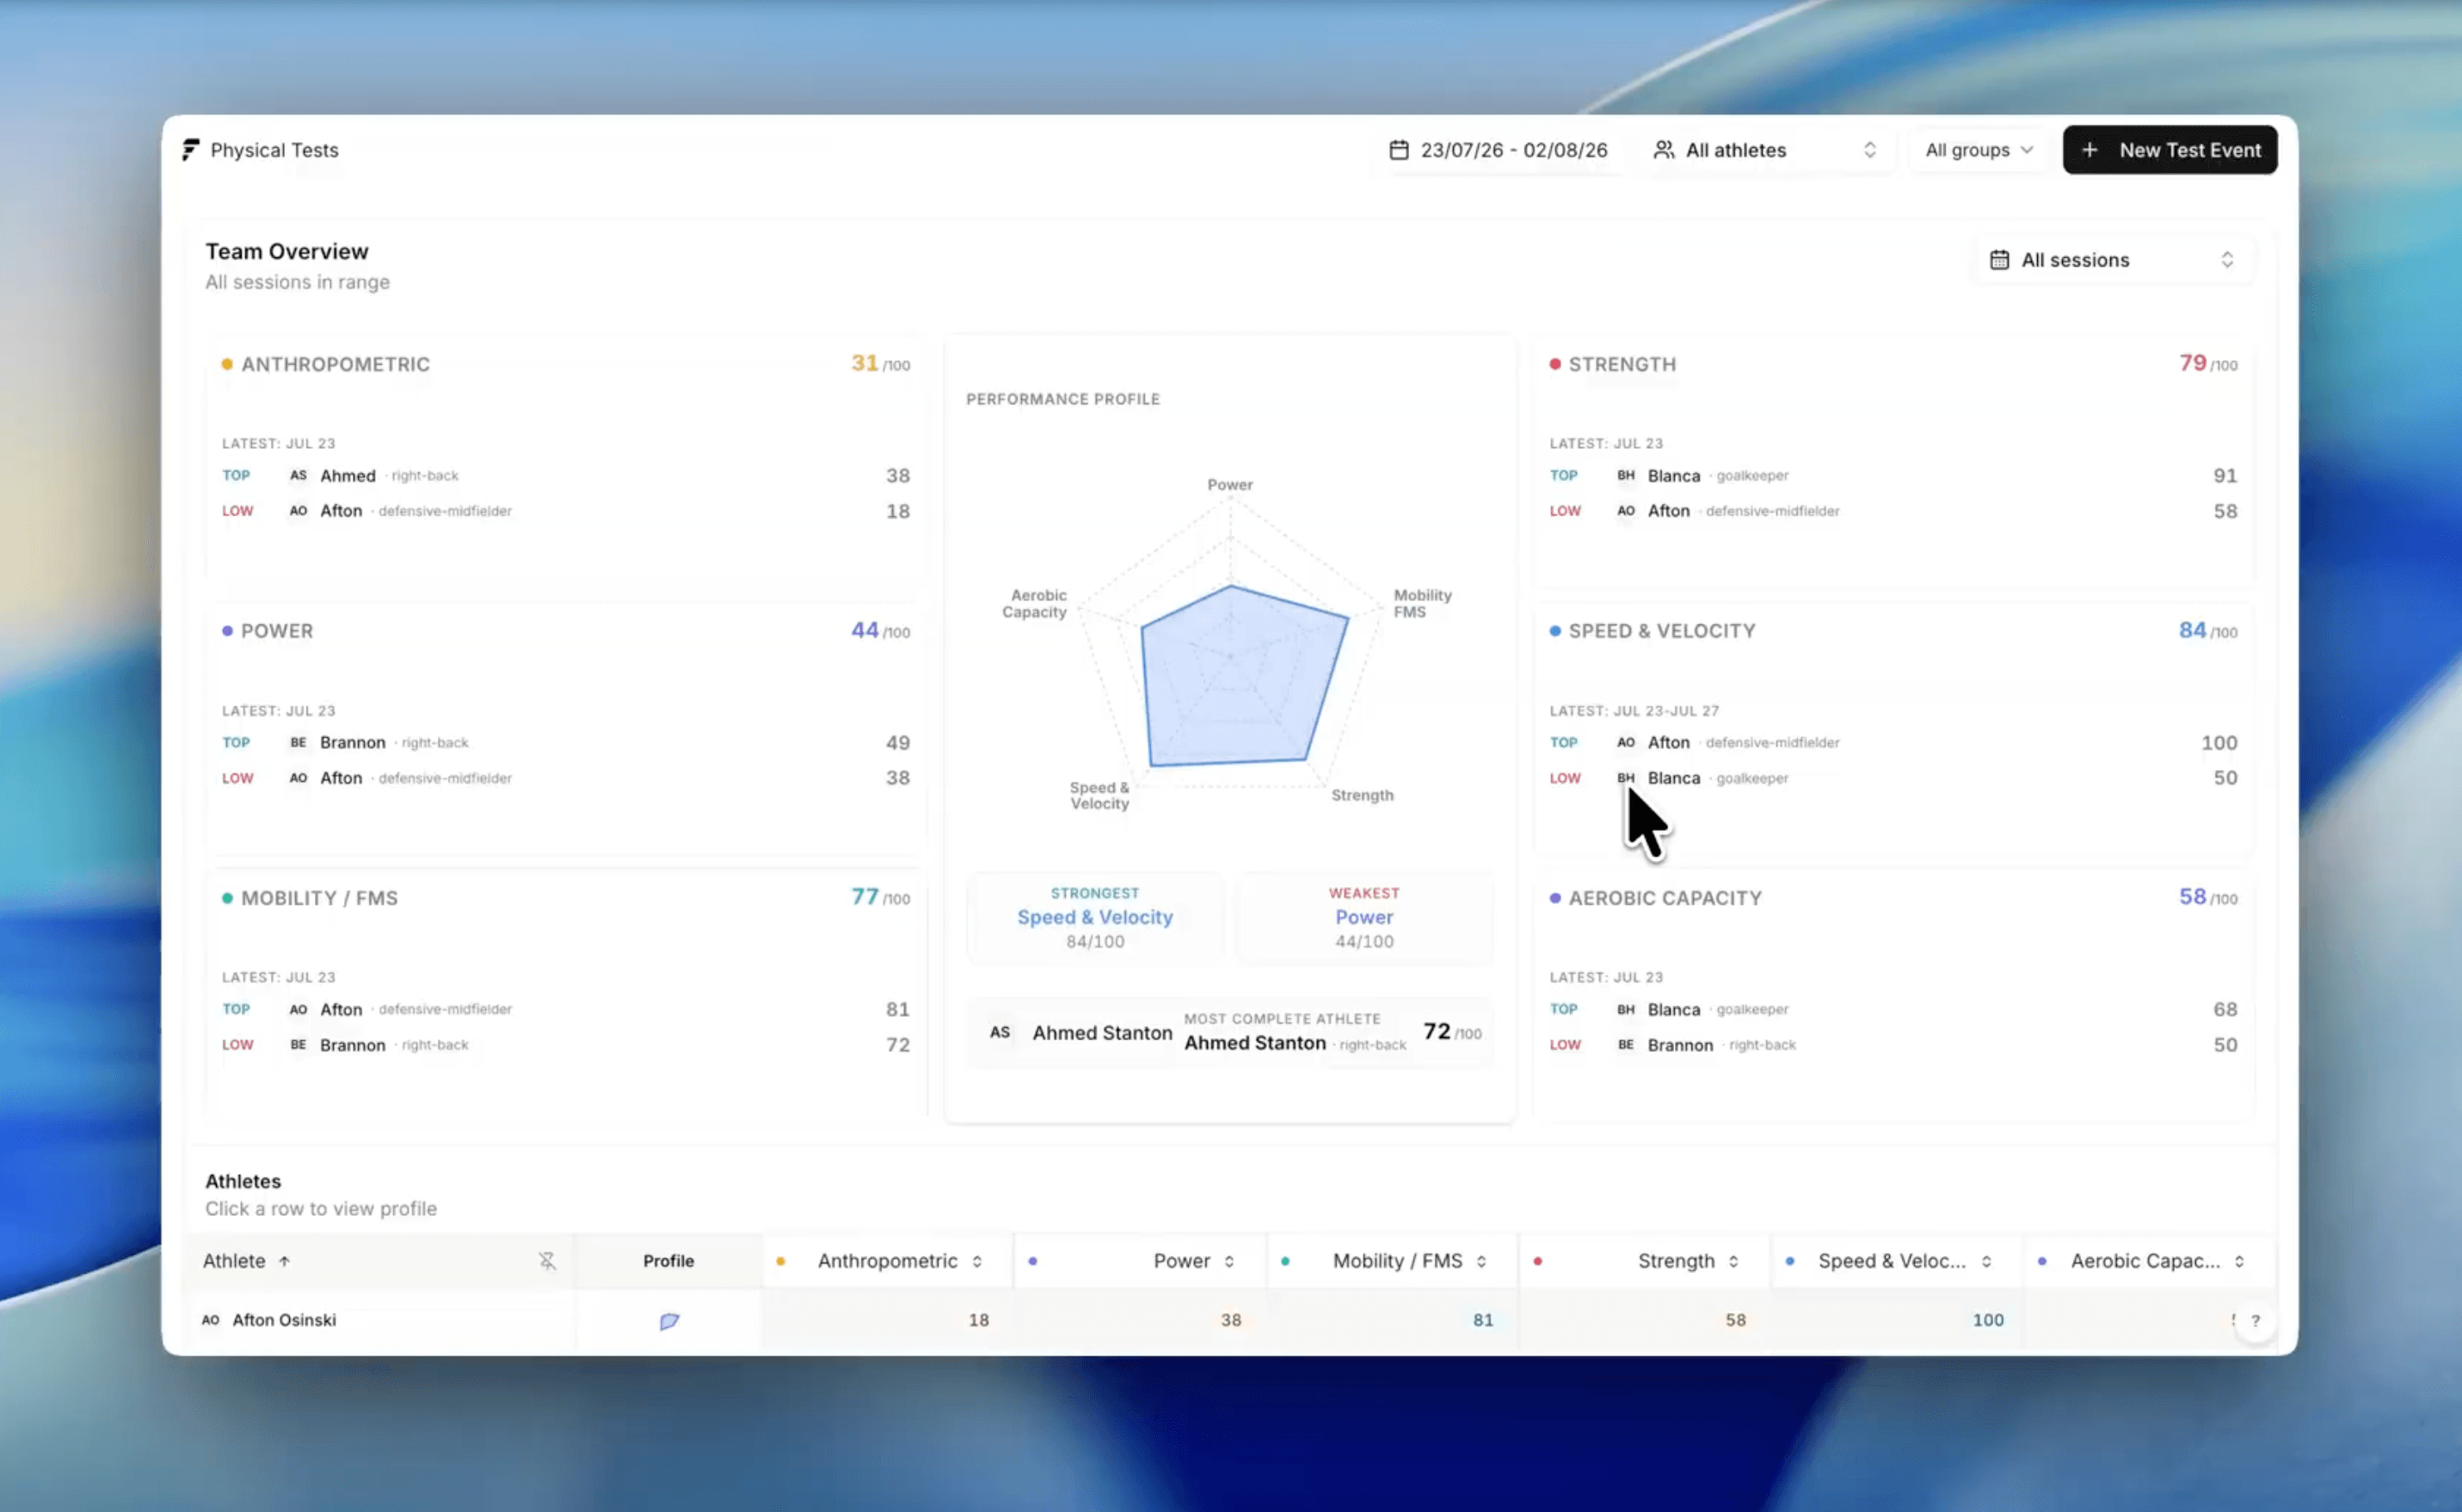
Fractall physical tests team overview, scoring a squad across anthropometric, power, mobility, strength, speed and aerobic capacity on a 0 to 100 scale, with a performance profile radar and a sortable athlete roster.

Yo-Yo IR1

The score table

Speed level, speed, and the distance an athlete has covered by the end of each level, from the first shuttle to the 91st.

Quick answer

The Yo-Yo Intermittent Recovery Test Level 1 is a series of 20 m out-and-back shuttles run to a beep, with 10 seconds of jogging recovery after each one. It starts at 10.0 km/h and ends when an athlete misses the line twice. Scores are written as level.shuttle, and each shuttle is 40 m, so 18.7 means 2,000 m. Estimated VO2max is distance multiplied by 0.0084, plus 36.4. Elite youth outfield players in published samples run between 2,220 m and 2,275 m, while the median across a 237-player youth squad aged 8 to 18 was 920 m.
Coaches look for this table for one reason. Someone finished on “level 18, shuttle 3” and the recording sheet needs a number in metres. Every level below adds 40 m per shuttle, so the running total is the column that matters.

Yo-Yo Intermittent Recovery Test Level 1

A progressive shuttle test of the ability to repeat high-intensity running, run as 2 x 20 m shuttles with 10 seconds of active recovery between each, at speeds dictated by an audio track.

Example: A score of 17.5 means the athlete completed every shuttle up to and including the fifth at speed level 17, which is 1,600 m.

Speed levelSpeedShuttles at this level and running total
510.0 km/h1 shuttle, 40 m
912.0 km/h1 shuttle, 80 m
1113.0 km/h2 shuttles, 160 m
1213.5 km/h3 shuttles, 280 m
1314.0 km/h4 shuttles, 440 m
1414.5 km/h8 shuttles, 760 m
1515.0 km/h8 shuttles, 1,080 m
1615.5 km/h8 shuttles, 1,400 m
1716.0 km/h8 shuttles, 1,720 m
1816.5 km/h8 shuttles, 2,040 m
1917.0 km/h8 shuttles, 2,360 m
2017.5 km/h8 shuttles, 2,680 m
2118.0 km/h8 shuttles, 3,000 m
2218.5 km/h8 shuttles, 3,320 m
2319.0 km/h8 shuttles, 3,640 m
The speed levels start at 5 rather than 1, which confuses people the first time they see it. They are inherited from the original Yo-Yo endurance test, where the lower levels existed. The IR1 simply begins partway up that scale, and there is no level 1 through 4 to look for.

91

Shuttles to complete the whole test

3,640 m in total. Almost nobody finishes it. Most squad members stop somewhere between level 14 and level 19.

Converting to estimated VO2max is one multiplication. The equation published alongside the test is distance in metres multiplied by 0.0084, plus 36.4, and the Level 2 version uses different constants entirely.
DistanceScore as level.shuttleEstimated VO2max
400 m13.339.8 mL/kg/min
800 m15.143.1 mL/kg/min
1,200 m16.346.5 mL/kg/min
1,600 m17.549.8 mL/kg/min
2,000 m18.753.2 mL/kg/min
2,400 m20.156.6 mL/kg/min
2,800 m21.359.9 mL/kg/min
3,200 m22.563.3 mL/kg/min

Treat the VO2max column as an estimate

It is a regression from a field test, not a measurement. It is useful for watching one athlete across a season and close to worthless for arguing with a laboratory number or comparing two athletes a few millilitres apart.

Running it

The protocol

Three lines, an audio track, and one rule that decides when an athlete is finished.

  1. 1

    Mark three lines

    A start line, a turning line 20 m away, and a third line 5 m behind the start. The 5 m zone is where the recovery jog happens, not a rest area.

  2. 2

    Run out and back on the beep

    One shuttle is 20 m out and 20 m back, so 40 m of running. The athlete has to have a foot on or over the line before the beep.

  3. 3

    Take 10 seconds of active recovery

    Jog to the 5 m cone and back after every shuttle. The clock does not stop, and a walked recovery changes the test.

  4. 4

    Let the audio raise the speed

    It starts at 10.0 km/h, jumps to 12.0, then 13.0, then climbs by 0.5 km/h. The athlete never sets the pace.

  5. 5

    Stop on the second failure

    One missed line is a warning. The second ends that athlete's test, and their score is the last shuttle they completed in time.

What you need on the day

  • A flat, non-slip run of at least 30 m, indoors or on grass.
  • Cones and a tape measure. The 20 m has to be 20 m.
  • The official audio track and a speaker everyone can hear over wind.
  • A recording sheet with a row per athlete and a column for the last completed shuttle.
  • At least two people officiating. One person cannot watch 20 athletes' feet and the line at the same time.

What quietly ruins the result

  • Walking the recovery instead of jogging it. The 10 seconds is part of the test, not a break from it.
  • Turning before the line. A short turn is a shorter test and an inflated score.
  • Testing after a hard session. This is a maximal test and it reads whatever fatigue you bring to it.
  • Unofficial audio downloads, where the beep spacing cannot be verified against the protocol.
  • A first-ever attempt. Scores tend to rise on a second exposure through pacing alone, so a familiarisation run makes the baseline honest.
The test is usually over in 5 to 15 minutes per wave. For a squad of 20 you are realistically looking at about 45 minutes with the warm-up and the briefing, which is why it tends to land on a pre-season testing day next to everything else rather than on its own.

Reference values

What a good score is, and why most tables cannot tell you

The rating bands circulating online were built by running the VO2max equation backwards, not by measuring a population.

Search for Yo-Yo IR1 norms and you will find the same six-band table on several sites. Elite, excellent, good, average, below average, poor, with distances attached for men and women. It looks like measured data and it is the table most squads get graded against.

Where that table comes from

Topend Sports, which publishes it, states that the bands are not based on any specific research and were assembled from various sources. theyoyotest.com carries the same bands and credits Topend Sports as their origin, describing the method as taking existing VO2max fitness ratings and running the Yo-Yo VO2max estimation equation across them, then adjusting against assorted athlete results. That is a conversion of a general fitness scale, not a distribution measured on athletes who ran this test.
This does not make the table useless, and the sites publishing it are open about what it is. It makes it the wrong tool for the job most coaches use it for. Telling a 16-year-old full-back they are “average” carries a different weight when the word came out of a formula rather than out of a squad that looks like theirs.
The values worth using name their population. For senior men, the reference distances from the original review run roughly from 1,810 m for moderately trained players to 2,420 m at international level. We have tabulated those with their sources in our physical test norms guide for senior football, which is the better page to read if senior reference values are what you came for.

On the female reference values

Distances of roughly 1,600 m, 1,360 m and 1,160 m for international, elite and sub-elite women circulate widely. We have not published them as verified, because every trail we followed led to secondary reporting rather than to the primary paper. If you use them, use them as a loose orientation and not as a grading scale.
Bangsbo J, Iaia FM, Krustrup P. The Yo-Yo intermittent recovery test: a useful tool for evaluation of physical performance in intermittent sports. Sports Medicine, 2008;38(1):37-51. Rating band provenance as described by Topend Sports and theyoyotest.com, September 2026.

Population

Position and age change the number more than fitness does

Measured values from elite youth football and from a 237-player youth squad, with the sample behind each one.

The most useful position data comes from 123 players in the top division of Czech youth football, averaging 15.7 years. It is one club system at one age, which is exactly the caveat that belongs next to it, but it is measured rather than derived.
PositionYo-Yo IR1 distancePlayers measured
Full-back2,275 ± 205 m25
Attacker2,236 ± 193 m22
Central midfielder2,232 ± 251 m25
Wide midfielder2,229 ± 192 m27
Central defender2,220 ± 284 m15
Goalkeeper1,815 ± 378 m9

The outfield positions are not different

Full-backs to central defenders covers 55 m, and every group's standard deviation is at least 192 m. Goalkeepers sat significantly below the outfield players, and that gap is real. Splitting outfield norms by position is reading noise.

920 m

Median Yo-Yo IR1 distance across 237 youth players aged 8 to 18

The range ran from 280 m to 3,080 m at a single Polish club. Age drives most of that spread, which is why a single youth norm is not a useful object.

Those two samples together are the argument against grading a mixed academy against one table. A 3,080 m score and a 280 m score came out of the same club. Comparing an athlete against their own previous score, or against their own age group in your own squad, survives contact with reality in a way that a downloaded band does not.
Position values: Bujnovky D, Maly T, Ford KR, et al. Physical Fitness Characteristics of High-level Youth Football Players: Influence of Playing Position. Sports (Basel), 2019;7(2):46. Youth distribution: Korzeniewski K, Makuch R, Mikielewicz M, et al. Yo-Yo IR1-derived aerobic endurance machine-learning prediction in youth male soccer players. Frontiers in Physiology, 2026;17:1904809.

After the test

What to do with the number on Monday

Three decisions the score can support, and one it cannot.

The Yo-Yo IR1 is sensitive to training. That is its main advantage over a laboratory VO2max, which moves slowly and often does not move at all in already-trained athletes. A pre-season to mid-season change on this test is usually a real change in the capacity you were training.

What the score can support

  • Grouping the squad for conditioning work, so the athlete at 1,400 m and the athlete at 2,400 m are not running the same intervals.
  • Checking whether a block of conditioning did anything, by retesting at the end of it.
  • Setting a return-to-training benchmark, where the target is the athlete's own previous score rather than a squad standard.

What it cannot support

  • Selection. It measures one quality, on one day, and it rewards athletes who pace well.
  • Comparing your squad against a table whose population you cannot see.
  • Reading a small change as progress. Without a familiarisation run and a repeat measure on your own squad, you do not know this test's error in your hands.
The last one is worth sitting with. We could not find a typical error figure for the IR1 that we were willing to publish as a threshold, which means the honest position is that you should establish your own before treating a 120 m improvement as real. Test twice in a week on a settled squad and the spread you see is your noise floor.
A retest that goes the wrong way is also worth reading against what the squad actually did in the weeks before it. A drop of 200 m after a heavy block is a different conversation from the same drop in a quiet fortnight, which is the case for keeping session RPE running underneath a testing calendar rather than testing in isolation.

In Fractall

Where a testing day lives

What the physical tests module does with a testing day, and what it does not do yet.

A testing day in Fractall

1

Enter the whole squad's results for a testing day in one grid rather than one athlete at a time.

2

Every test scores onto the same 0 to 100 scale across six categories, so a squad ranks the same afternoon it was tested.

3

Each athlete's score sits next to the team mean and against sex-specific thresholds, on the same record as their load and wellness.
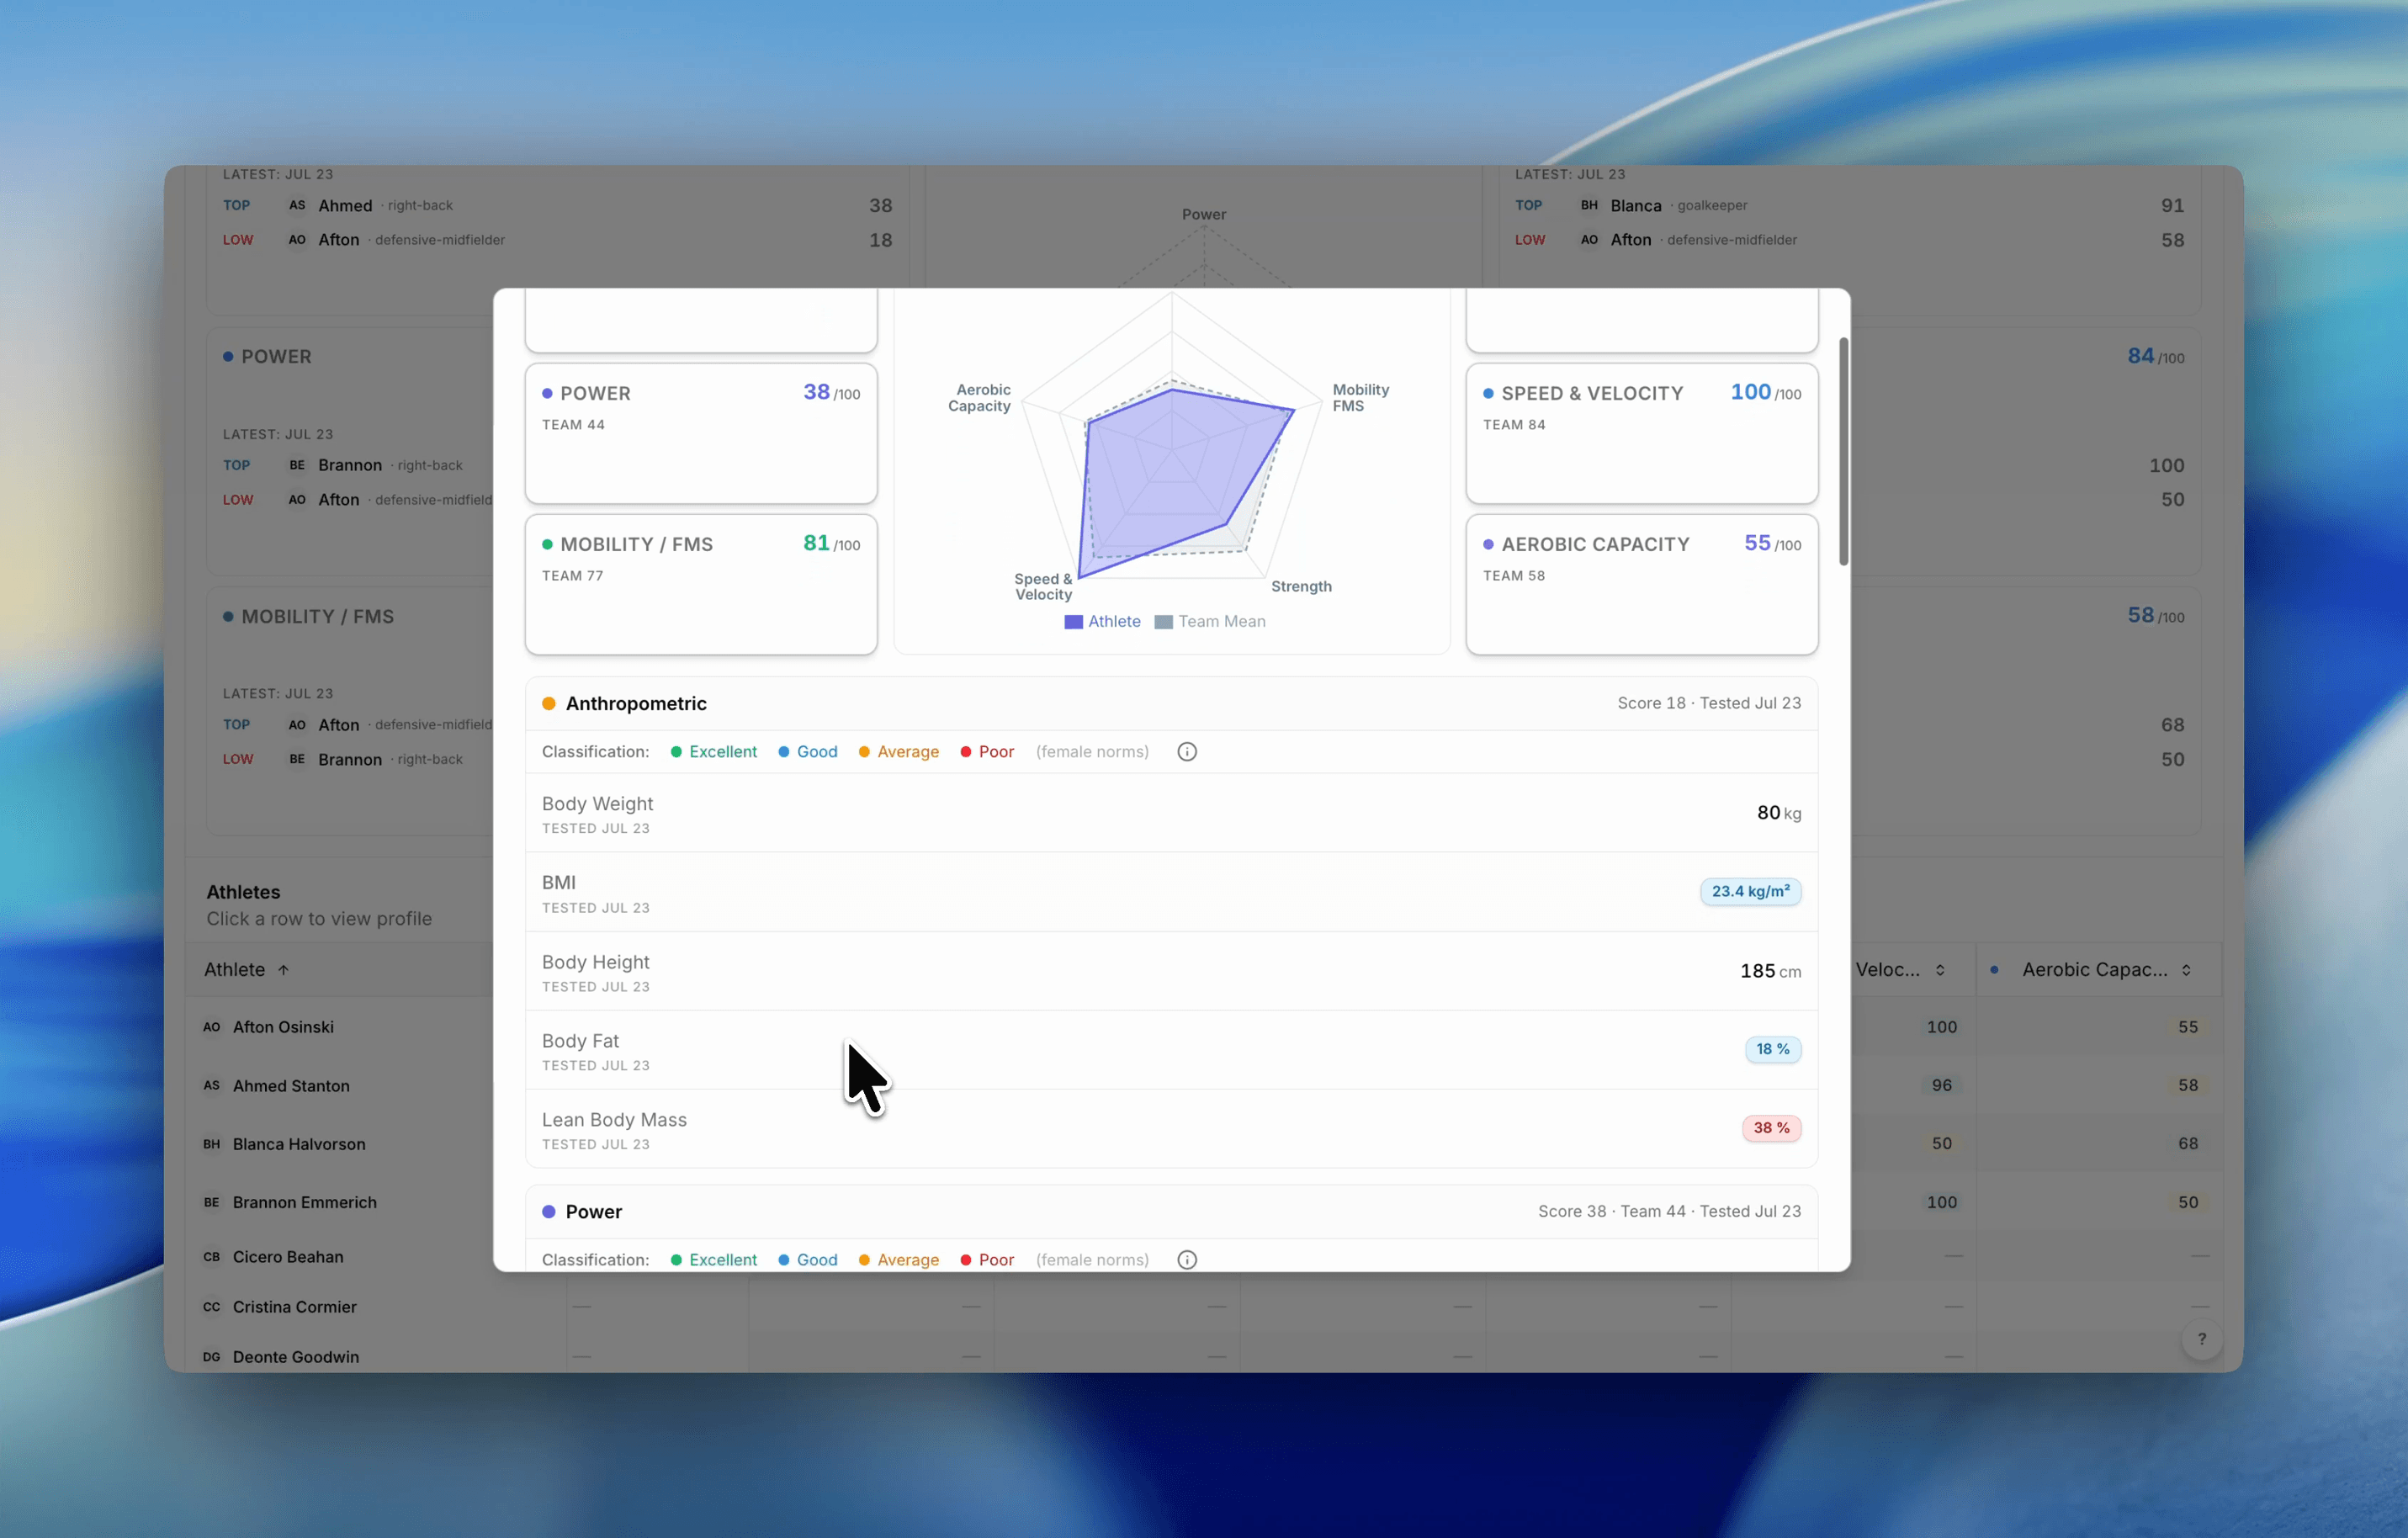
A Fractall athlete profile showing scores per test category next to the team mean, a radar comparing the athlete against that mean, and classification bands set to female norms.
The comparison this guide argues for, made automatic: each category scored against the squad's own mean rather than a downloaded band, with the classification set to the right sex norms.

The Yo-Yo IR1 is not one of the seeded tests

Fractall ships 23 seeded protocols across six categories, and the aerobic category currently holds the Bronco alone. If the Yo-Yo IR1 is your aerobic test, this guide is the reference and your recording sheet is still a sheet. We would rather say that here than have you find it in week one of a trial.
The related limit is worth stating too. The dashboard shows the latest result rather than a progress line, and it cannot yet diff one testing session against another, so a retest delta is still your subtraction.
What the physical tests module does change is the afternoon after a testing day. A test result also reads differently beside the fortnight that produced it, which is why it sits on the same athlete record as the rest of a pre-season monitoring plan, and next to the Bronco if that is the aerobic test you run.

Rank the squad the same afternoon you test them

Enter a whole testing day in one grid and read every athlete against the team mean. No hardware, and the first 4 weeks are free.

Start free trial

FAQs

Frequently asked questions

The questions coaches ask when a Yo-Yo score needs turning into a decision.

How long is a Yo-Yo IR1 test?

For most athletes, between 5 and 15 minutes. The test runs to a maximum of 91 shuttles and 3,640 m, but almost nobody reaches that. A squad of 20 tested in two waves usually takes about 45 minutes including the warm-up and the briefing.

What is a good Yo-Yo IR1 score?

It depends entirely on who you are comparing against, and most published rating tables do not say. In elite Czech youth football at 15.7 years, outfield players averaged between 2,220 and 2,275 m while goalkeepers averaged 1,815 m. In a 237-player youth squad aged 8 to 18 at one Polish club, the median was 920 m and the range ran from 280 to 3,080 m. Senior male reference distances sit roughly between 1,810 m and 2,420 m depending on competitive level.

What is the difference between the Yo-Yo IR1 and the Yo-Yo IR2?

The starting speed and what the test stresses. The IR1 starts at 10.0 km/h and is aimed at aerobic capacity during intermittent work. The IR2 starts at 13.0 km/h and loads the anaerobic system harder, which makes it a test for already well-trained athletes. They also use different VO2max equations, so an IR2 score cannot be read off an IR1 table.

How do you convert a Yo-Yo IR1 score to VO2max?

VO2max in mL/kg/min equals the distance in metres multiplied by 0.0084, plus 36.4. A 2,000 m score gives roughly 53.2. The equivalent IR2 equation is distance multiplied by 0.0136, plus 45.3. Both are estimates from a field test rather than measured values, so use them to track one athlete over time rather than to compare against laboratory VO2max figures.

Does playing position affect Yo-Yo IR1 scores?

Less than most coaches expect. In 123 elite Czech youth players, goalkeepers scored significantly below everyone else, but full-backs, central defenders, wide midfielders, central midfielders and attackers finished within 55 m of each other, which is well inside the standard deviation of every group. Separate outfield norms by position are hard to justify from that data.

Related guides