

GPS Acceleration Metrics: What All 23 Actually Mean
GPS acceleration metrics explained: what all 23 columns in your export measure, which five to report, and which to drop. Start with the five-metric panel.
Updated first published
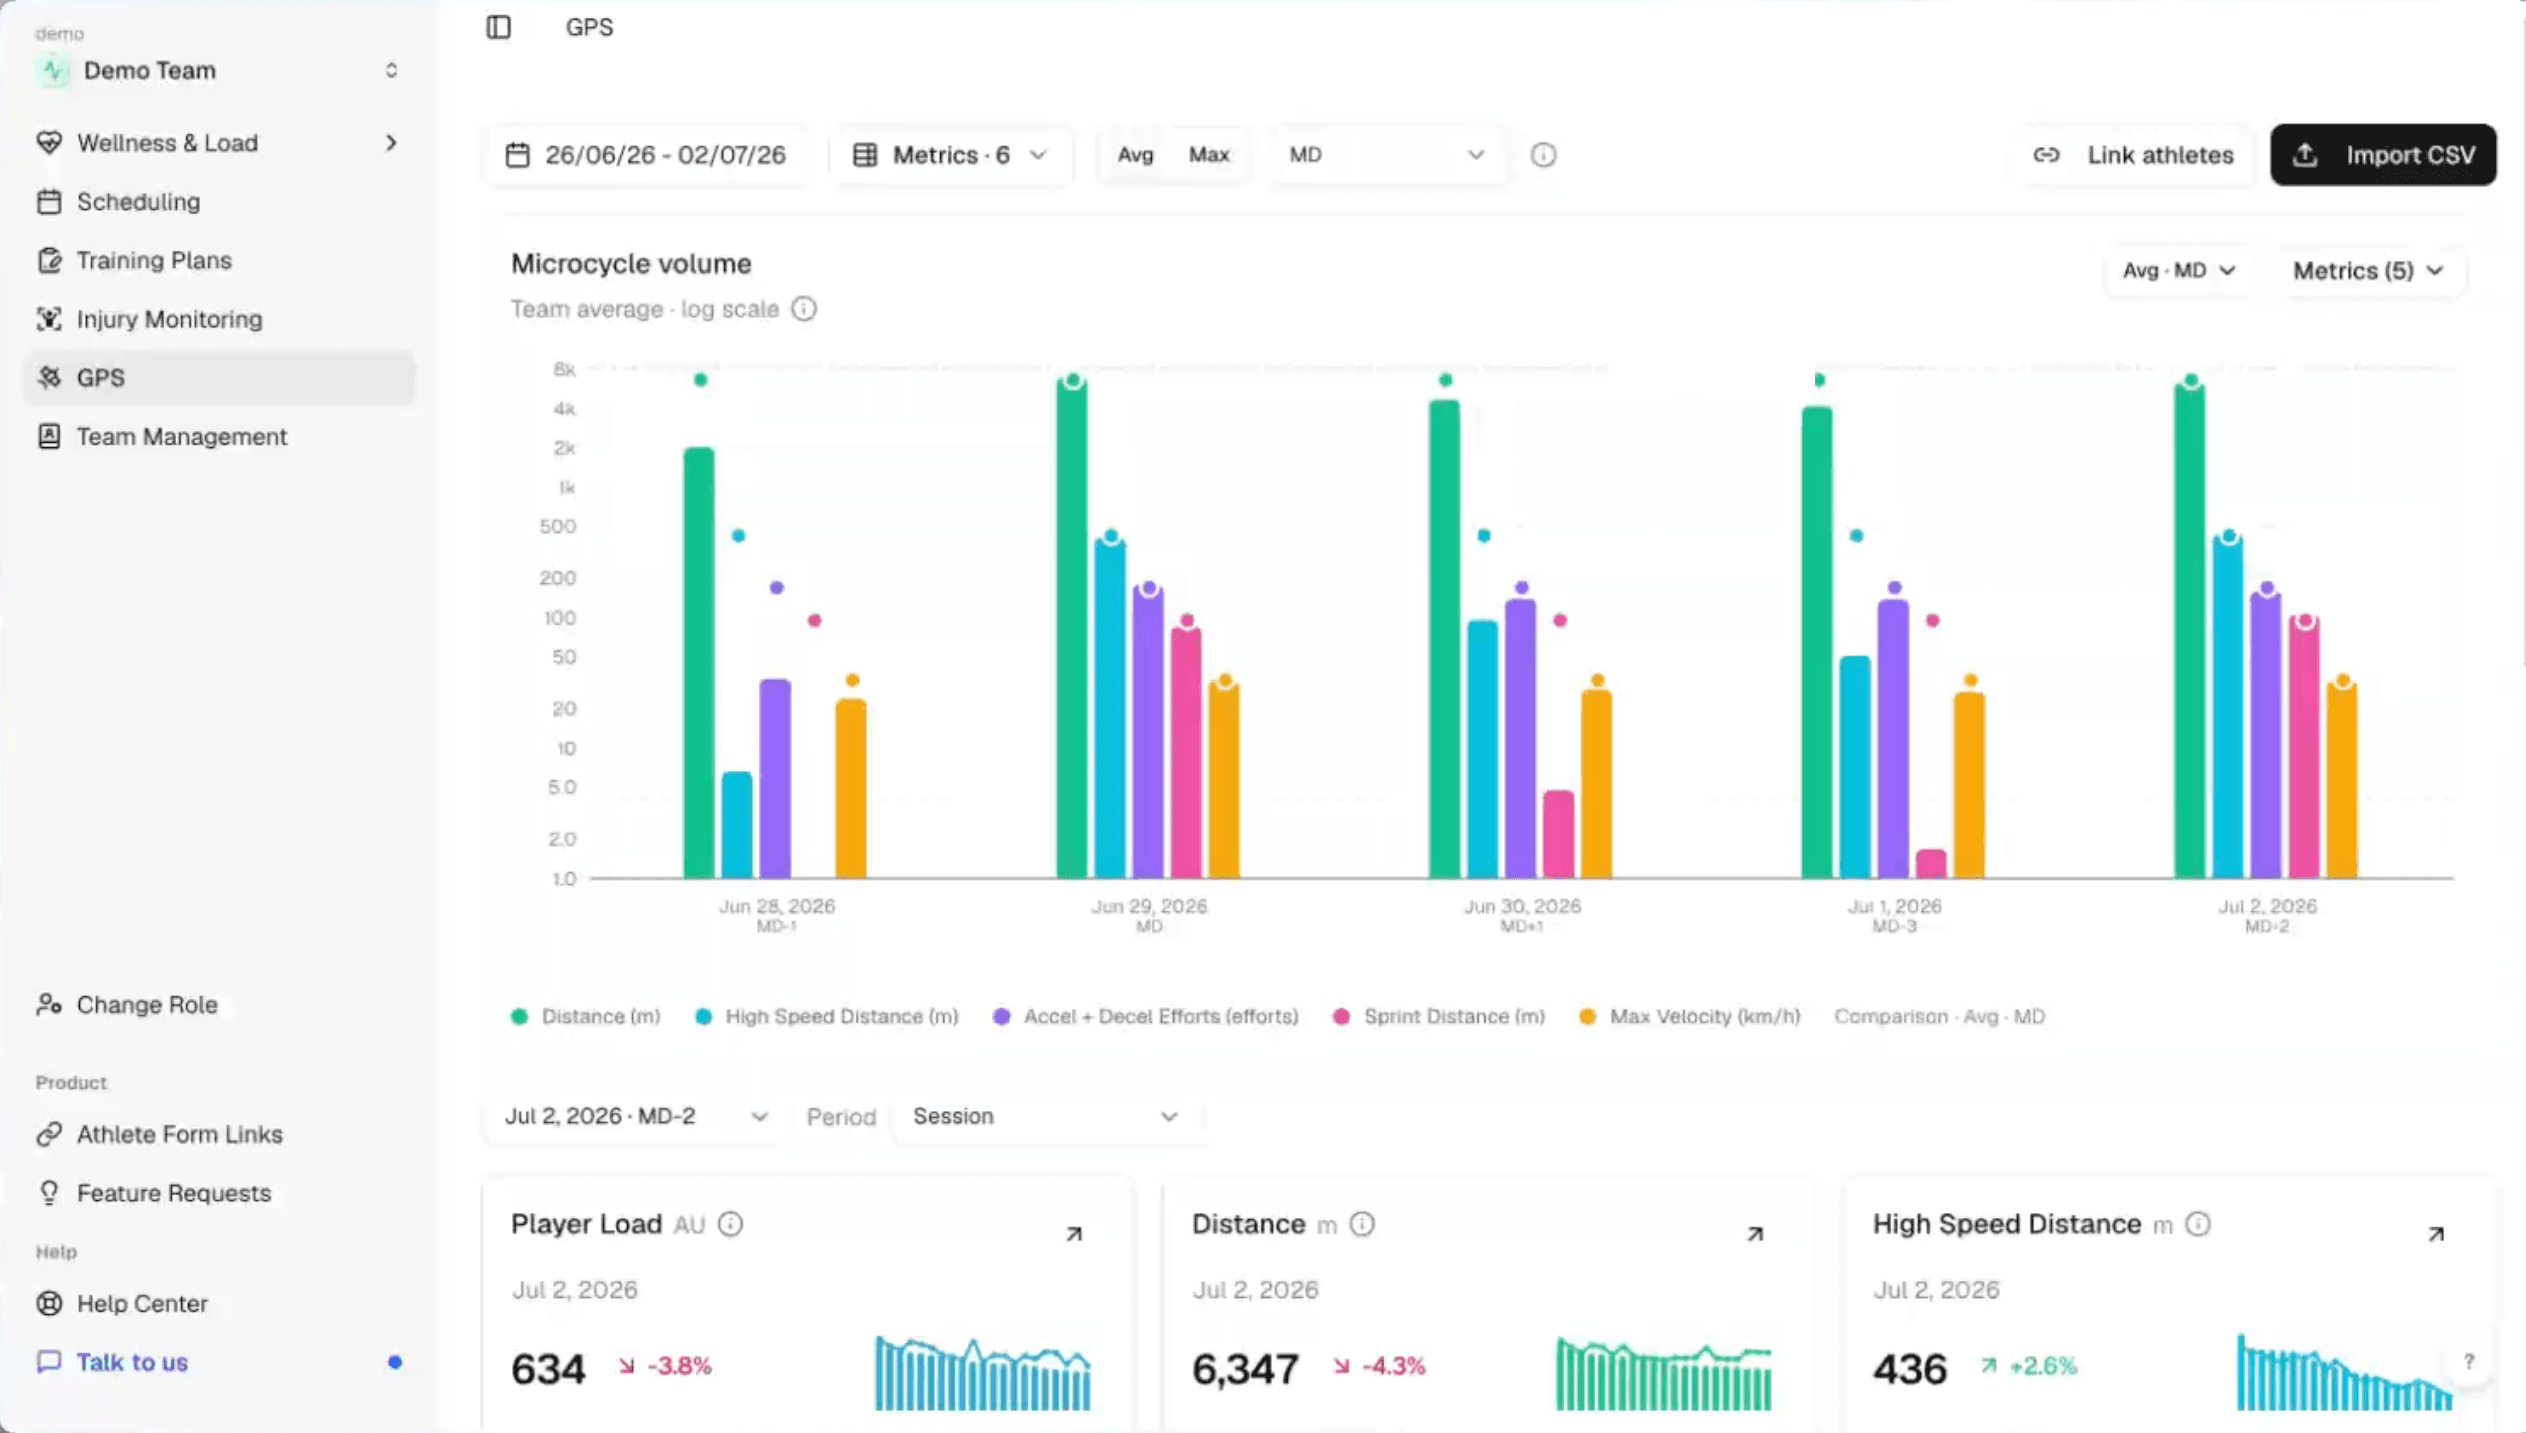
External load
What GPS acceleration metrics actually measure
They measure three things: how often an athlete changed speed, how hard, and over what distance. Every column in the acceleration block is one of those three, in a different unit or at a narrower intensity.
Quick answer
Acceleration
Rate of change of speed, in metres per second squared. It is not speed. An athlete at 3 m/s² is adding three metres per second to their speed, every second.
Example: A standing start to 6 m/s in two seconds averages 3 m/s².
Deceleration
Acceleration with a negative sign. Braking. Providers report it either as a negative number or as a separate positive column, which is worth checking before you build any calculation on it.
Example: Slowing from 7 m/s to a standstill in one second is roughly -7 m/s².
Effort
Not an instant. An effort is a period spent above a threshold, held for a minimum duration. Both of those settings are decisions someone made, and both change the count.
Example: The same sprint counts as one effort at 0.4s minimum duration and zero at 1.0s.
Comparability
Why your acceleration counts don't match anyone else's
Two settings decide the number, and most reports never state either one.
124
Studies reviewed on acceleration quantification
Delves and colleagues screened the elite team-sport literature from 2010 to 2020.
32.3%
Reported a minimum effort duration
Forty of the 124. The most common setting was 0.5 seconds, used in 18 studies.
12.9%
Reported how they filtered the signal
Sixteen of the 124. The rest published counts you cannot reproduce.
Between 2.5 and 3.0 m/s² is where most of the published work sits. Harper and colleagues used 2.5 m/s² as their high-intensity cut-off across a meta-analysis of elite team sport, and several providers ship 3.0 as a default.
What to do about it
Reference
All 23 acceleration metrics, grouped by what they do
Grouped by function rather than alphabetically, because the useful question is which of these is the same number twice.
Counts: how many efforts
Seven metrics, all answering the same question at different intensities. Reporting more than two or three of these puts the same information on the page repeatedly.
| Metric | Unit | What it tells you |
|---|---|---|
| Accel + Decel Efforts | efforts | Every effort past the threshold in both directions, added together. The one number to use if you only report one. |
| Acceleration Efforts | efforts | How many times the athlete crossed the acceleration threshold. Volume of speeding up. |
| Deceleration Efforts | efforts | How many times they braked harder than the threshold. In football this is usually the bigger of the two. |
| High Acceleration Efforts | efforts | Accelerations in the high-intensity band only. Strips out the gentle changes of pace. |
| Max Acceleration Efforts | efforts | Accelerations in the top band. Counts are small, so a single session says little. Read it weekly. |
| High Deceleration Efforts | efforts | Decelerations in the high-intensity band. The braking equivalent, and the one most club reports leave out. |
| Max Deceleration Efforts | efforts | The hardest braking band. Tiny counts, high mechanical cost per repetition. |
Rates: how often per minute
The same counts divided by session minutes. This is the group that turns volume into intensity, and it is the group most often missing from club reports.
| Metric | Unit | What it tells you |
|---|---|---|
| Accelerations Per Minute | efforts/min | Acceleration efforts divided by session minutes. Makes a 25-minute rondo and a 90-minute match comparable. |
| Decelerations Per Minute | efforts/min | Braking rate. Climbs in small-sided games, where the pitch is short and every run ends early. |
| Accel + Decel Efforts Per Minute | efforts/min | Combined rate. The cleanest single intensity number in the whole acceleration block. |
Peaks and intensity: how hard
Magnitudes rather than counts. These describe the sharpest moment of a session, or its average sharpness, rather than how much of it there was.
| Metric | Unit | What it tells you |
|---|---|---|
| Max Acceleration | m/s² | The single hardest acceleration in the session. A capacity marker, not a load marker. |
| Max Deceleration | m/s² | Hardest braking effort. Sensitive to neuromuscular fatigue, which is what makes it worth trending. |
| Acceleration Density | m/s² | The average of every acceleration and braking value across the period, ignoring direction. It never touches a threshold, so it can't be gamed by one. |
Distances: how far while changing speed
Metres accumulated inside an intensity band. These separate a long rolling build-up from a short violent one, which a count treats as identical.
| Metric | Unit | What it tells you |
|---|---|---|
| High Acceleration Distance | m | Metres covered while accelerating in the high band. A long build-up and a short burst read differently here, and identically in a count. |
| Max Acceleration Distance | m | Metres covered in the top acceleration band. Usually a fraction of the high-band figure. |
| High Deceleration Distance | m | Metres covered while braking in the high band. |
| Max Deceleration Distance | m | Metres covered in the hardest braking band. Short by nature, because hard braking ends quickly. |
Gen 2 bands: the same efforts, sorted
Gen 2 is Catapult's second-generation acceleration processing. Instead of counting everything past one threshold, it sorts efforts into three acceleration bands and three deceleration bands. B1 to B3 refers to those bands, so B2-3 means the two harder ones and B3 means the hardest alone.
| Metric | Unit | What it tells you |
|---|---|---|
| Acceleration B1-3 Efforts (Gen 2) | efforts | Every Gen 2 acceleration effort across all three bands. The band-system version of total acceleration efforts. |
| Deceleration B1-3 Efforts (Gen 2) | efforts | Every Gen 2 deceleration effort across all three bands. |
| Acceleration B2-3 Efforts (Gen 2) | efforts | The two higher acceleration bands only. Drops band 1, where most of the noise sits. |
| Deceleration B2-3 Efforts (Gen 2) | efforts | The two hardest braking bands. A reasonable stand-in for high-intensity deceleration efforts. |
| Deceleration B3 Efforts (Gen 2) | efforts | Band 3 alone, the hardest braking there is. Expect single digits. |
| Acceleration B1-3 Distance (Gen 2) | m | Metres covered while performing Gen 2 acceleration efforts across all bands. |
Braking load
Do athletes decelerate more than they accelerate?
In football, clearly yes, and by a margin most reporting does not reflect.
80-104%
More high-intensity decelerations than accelerations
Professional soccer match play: 51 to 65 high-intensity decelerations against 27 to 35 accelerations.
2.7x
Ground reaction force in the braking steps
Up to 2.7 times the force of the matching acceleration steps. Around 58 N/kg against 21 N/kg for a 75 kg athlete.
<50 ms
Time to absorb the impact peak
High peak forces arrive in the first 10 to 40% of stance and have to be dissipated in under 50 milliseconds.
What this changes in your report
The verdict
Which acceleration metrics should you actually report?
Five: accel + decel efforts, accel + decel efforts per minute, deceleration efforts, high deceleration efforts, and max deceleration. Everything else duplicates one of those at a different cut.
Report these five
- Accel + decel efforts. Your volume headline. One number for total mechanical work, comparable week to week.
- Accel + decel efforts per minute. Your intensity headline. Without it a short sharp session looks lighter than a long easy one.
- Deceleration efforts, reported separately. The braking half moves independently of the accelerating half, so a combined figure can hide it.
- High deceleration efforts. Where the mechanical cost concentrates. Small numbers, so read the weekly total rather than the daily one.
- Max deceleration. A neuromuscular fatigue signal. Trend it across the week and watch for a drop rather than reading any single value.
Drop these, and say why
- Any count you already report at a different intensity cut. High, max and total acceleration efforts are one metric with three filters.
- Max-band distances when your squad produces single-digit counts in that band. There is not enough signal to trend.
- Acceleration efforts per minute and decelerations per minute alongside the combined rate. Pick the combined one unless you have a specific question about a direction.
- Gen 2 band counts if you also report threshold-based counts. They answer the same question in a second vocabulary.
- Any metric nobody has looked at in six weeks. If it has never changed a session, it is furniture.
In Fractall
Where the acceleration data lands
One acceleration metric, charted properly, beside the rest of the athlete's record.
From provider export to squad chart
Run your normal post-session export. Catapult, STATSports, Oliver Sports and WIMU files are read directly, and columns from other providers can be mapped to Fractall's metrics manually when you bring the file in.
Drop the CSV into the GPS tab and link the athlete names in your file to your Fractall squad. You do that once, then every later import lines up on its own.
Sessions get labelled MD-3, MD-1, MD, MD+1 and charted together, so this week's accel + decel load sits next to last week's and next to the athlete's RPE and wellness.
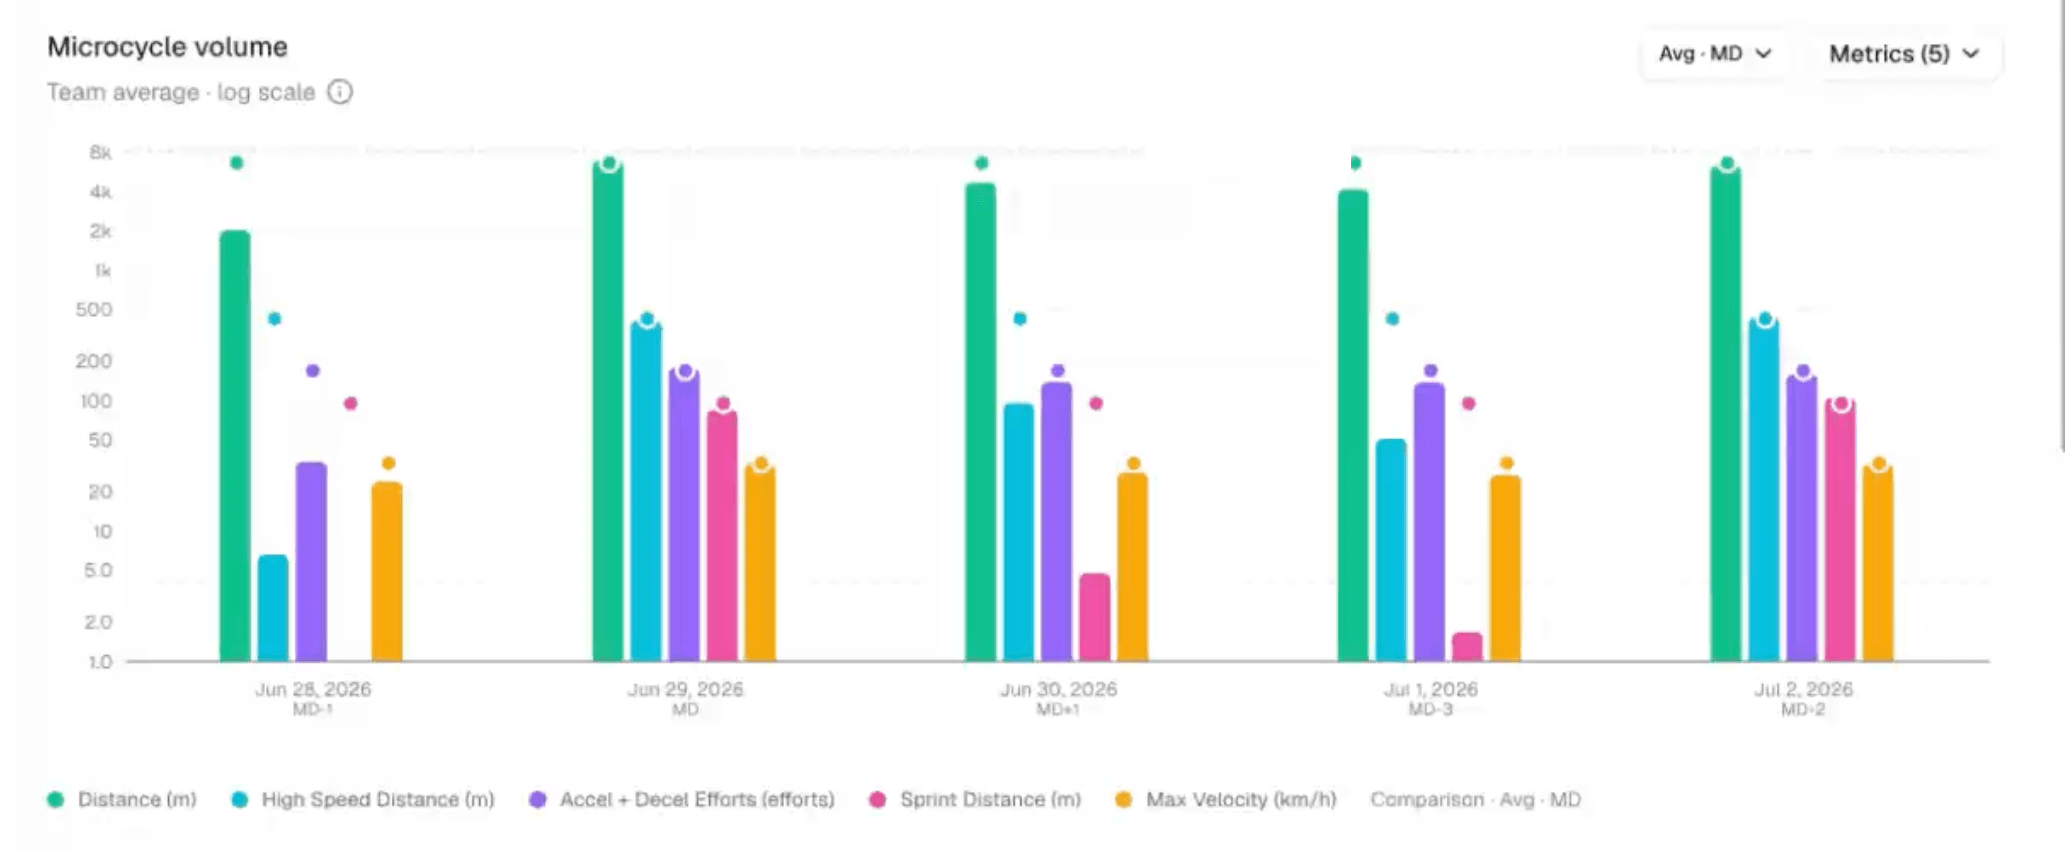
Map a provider CSV first
Pick Catapult, StatSports, Oliver, or WIMU, bind the core columns, and read session KPIs for three athletes in the browser.
Import the export you already have
Drop your Catapult, STATSports, Oliver Sports or WIMU CSV into Fractall and chart accel + decel efforts across the microcycle, beside RPE and wellness. One-month free trial, no card.
FAQs
Common questions about GPS acceleration metrics
How many accelerations should a player do in a session?
Should I use absolute or individualised acceleration thresholds?
What does Gen 2 mean in my GPS export?
Why are my deceleration counts higher than my accelerations?
Do I need GPS to monitor training load?
Related guides
Two Games a Week: What Wellness Data Shows Before Match 2
Fractall data on football teams playing two games a week: on match morning, fatigue sits less than half as far above normal. How to read wellness between games.
ChatGPT and Claude for Strength and Conditioning Coaches
What an S&C coach can ask ChatGPT or Claude about squad load, wellness and injuries, and the privacy settings to change before any athlete data goes in.
CMJ Test: Protocol, Norms and Why Devices Disagree
The same countermovement jump reads nearly 7 cm apart on a force plate, a phone app and a sensor. Triple the U16 to U18 gap. The protocol and the norms.