

GPS Speed & Distance Metrics: What All 27 Actually Mean
GPS speed and distance metrics explained: what all 27 columns measure, the thresholds behind high speed running and sprinting, and the five worth reporting.
Updated first published

External load
What GPS speed and distance metrics actually measure
They answer three questions: how far the athlete moved, how fast they were moving while they covered it, and what the fastest moment was. Every column in the speed and distance block is one of those three at a different cut.
Quick answer
Velocity band
A speed range with a floor and a ceiling. Band 1 is standing, band 6 is sprinting. Distance accumulates in whichever band the athlete's current speed falls into.
Example: A 40 m run that peaks at 6.5 m/s puts metres into bands 3, 4 and 5, and none into band 6.
Threshold
The speed a run must exceed to count as high-speed or sprint. Defaults are 5.5 m/s and 7 m/s, and both are settings someone chose, not laws of physics.
Example: A 24.5 km/h run is a sprint at WIMU's 24 km/h default and not a sprint at Catapult's 25.2.
Work rate
Distance divided by time, in metres per minute. It makes a 25-minute drill and a 90-minute match comparable, which raw distance can't do.
Example: 6,000 m in 60 minutes and 9,000 m in 90 minutes are the same 100 m/min.
10,000-13,000 m
Typical elite football match distance
Varies by position. The benchmark most club totals get read against.
100-120 m/min
Typical professional match work rate
Distance per minute in match play. Training drills sit above or below it depending on design.
Comparability
What counts as a sprint depends on who made your units
The default lines sit at 5.5 m/s for high speed and 7 m/s for sprinting, and almost every provider deviates from one of them.
| Provider | High-speed line | Sprint line |
|---|---|---|
| Catapult | 5.5 m/s default; HS Distance sums bands 5 and 6 | Band 6, >7 m/s default |
| STATSports | 5.5 m/s, the Zone 5 threshold | Sprint entries held for at least 1 second; documented default 19.8 km/h |
| WIMU | 21 km/h default | 24 km/h |
| Fitogether | Combined zones 4 and 5, above 5.5 m/s | Above 25 km/h, held for at least 0.6 seconds |
| JOHAN Sports | 19.8 km/h and above | 25.2 km/h and above, labelled High Sprint |
| GPEXE | Critiques fixed speed thresholds; prefers metabolic-power detection | No fixed line published |
Between 21 and 24 km/h is where several providers' defaults scatter. Counts drop sharply with every extra km/h, which is why two clubs' sprint numbers rarely match.
Reference
All 27 speed and distance metrics, grouped by what they do
Grouped by function rather than alphabetically, because the useful question is which of these is the same number twice.
Volume: how far
Total distance and its thresholded cuts. Each row keeps a narrower, faster slice of the same session.
| Metric | Unit | What it tells you |
|---|---|---|
| Distance | m | Total metres covered. The baseline volume figure that every other distance metric filters down. |
| High Speed Distance | m | Metres above the high-speed line, 5.5 m/s by default. The share of the volume that meaningfully taxes the athlete. |
| High Intensity Distance | m | Metres between the high-speed and sprint lines. High-speed volume with the sprint metres stripped out. |
| Sprint Distance | m | Metres above the sprint line, 7 m/s by default. Small totals, and the number to watch for top-end exposure. |
| Explosive Distance | m | STATSports metric: high metabolic load distance minus high speed running. Hard work in tight spaces that never reaches speed. |
Band distances: the same metres, renamed
Six bands, and up to three names for each. Standing, walking, jogging and running distance are velocity bands 1 to 4. Zone 5 and zone 6 are bands 5 and 6. If your report carries both a named distance and its band twin, one of them is furniture.
| Band (default speeds) | Also exported as | What it covers |
|---|---|---|
| Velocity Band 1 (0-0.2 m/s) | Standing Distance | Standing or virtually stationary. Fills the total, tells you nothing about load. |
| Velocity Band 2 (0.2-2 m/s) | Walking Distance | Walking. Recovery between efforts, set-piece positioning, water breaks. |
| Velocity Band 3 (2-4 m/s) | Jogging Distance | Jogging. Usually the biggest single band in a football session. |
| Velocity Band 4 (4-5.5 m/s) | Running Distance | Moderate running, below the high-speed line. |
| Velocity Band 5 (5.5-7 m/s) | Distance Zone 5 / High Intensity Distance | High-speed running below sprint pace. Where high-intensity volume accumulates. |
| Velocity Band 6 (>7 m/s) | Distance Zone 6 / Sprint Distance | Sprinting at or near maximal speed. Same number as sprint distance under default bands. |
Rates: how much per minute
Distances divided by session minutes. This is the group that turns volume into intensity, and the group that makes drills of different lengths comparable.
| Metric | Unit | What it tells you |
|---|---|---|
| Distance Per Minute | m/min | Total distance divided by session minutes. The standard work-rate figure. |
| Average Speed | m/min | The same calculation as distance per minute under another name. Catapult calls it meterage per minute. |
| High Speed Distance Per Minute | m/min | High-speed metres per minute. The rate at which high-intensity running accumulates. |
| Sprint Distance Per Minute | m/min | Sprint metres per minute. Sprint exposure as a rate rather than a total. |
Counts: how many runs
Efforts past a speed line. A count and a distance answer different questions: sprint efforts tells you how often, sprint distance tells you how much.
| Metric | Unit | What it tells you |
|---|---|---|
| Sprint Efforts | efforts | How many runs crossed the sprint line. Ten short sprints and two long ones read very differently here than in sprint distance. |
| High Speed Efforts | efforts | Runs past the high-speed line. STATSports exports this as zone entries. |
| Velocity B6+ Efforts (Gen 2) | efforts | Catapult's band-system count of sprint efforts. The same question as sprint efforts in a second vocabulary. |
Peaks and indices: how fast at best
The fastest moment of the session, in absolute terms and relative to the athlete's own ceiling, plus one proprietary index.
| Metric | Unit | What it tells you |
|---|---|---|
| Max Velocity | km/h | The single fastest moment of the session. A capacity marker, not a load marker. |
| Max Vel (% Max) | % | Session peak as a percentage of the athlete's own maximum. Tells you whether they touched top speed this week. |
| Speed Intensity | AU | STATSports proprietary index: a weighted accumulation of instantaneous speed. Trend it within one system only. |
Top-end speed
Max velocity: the number that anchors everything else
It's the denominator for every relative threshold and the fastest single data point of the session, which is exactly why it needs care.
How to read Max Vel (% Max)
The verdict
Which speed and distance metrics should you actually report?
Five: total distance, distance per minute, high speed distance, sprint distance and max velocity. Everything else duplicates one of those at a different cut.
Report these five
- Total distance. Your volume headline, and the number the rest of the staff already understands.
- Distance per minute. Your intensity headline. Without it a short sharp session looks lighter than a long easy one.
- High speed distance. The volume that costs something. Check whether yours includes the sprint band, then stay consistent.
- Sprint distance. Top-end exposure. Small totals, so trend the weekly figure rather than judging a single session.
- Max velocity, read alongside % of max. The capacity anchor, and the check on whether sprint exposure actually happened.
Drop these, and say why
- Named band distances alongside their zone twins. Standing distance and velocity band 1 distance are one number with two labels.
- Walking and jogging distance in a coach-facing report. They fill the total without changing a decision.
- Average speed next to distance per minute. Same calculation, second name.
- Per-minute variants of metrics nobody acts on. High speed distance per minute earns a place in drill comparisons; most reports don't use it.
- Speed Intensity outside an all-STATSports environment. Proprietary index, no cross-provider equivalent.
In Fractall
Where the speed and distance data lands
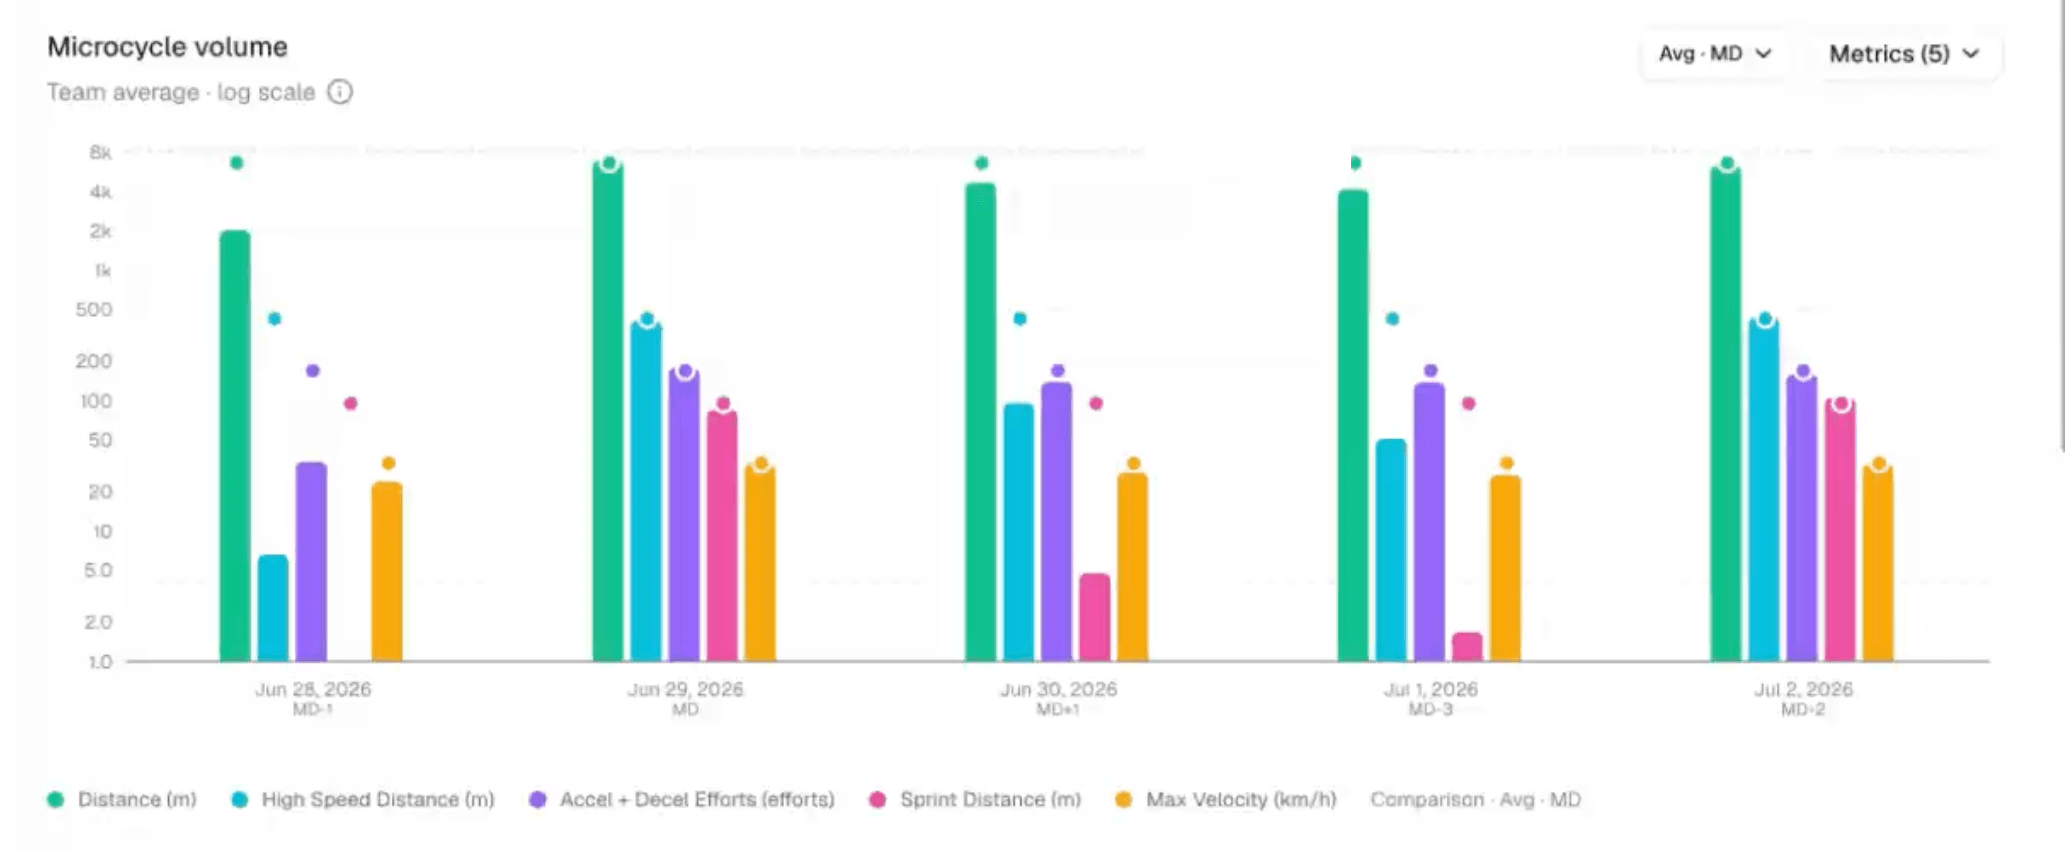
Four of the six metrics Fractall charts from a GPS file come from this block.
From provider export to squad chart
Run your normal post-session export. Catapult, STATSports, Oliver Sports and WIMU files are read directly, and columns from other providers can be mapped to Fractall's metrics manually when you bring the file in.
Drop the CSV into the GPS tab and link the athlete names in your file to your Fractall squad. You do that once, then every later import lines up on its own.
Sessions get labelled MD-3, MD-1, MD, MD+1 and charted together, so this week's high-speed and sprint volume sits next to last week's and next to the athlete's RPE and wellness.
Map a provider CSV first
Pick Catapult, StatSports, Oliver, or WIMU, bind distance, high-speed, sprint and max velocity, and read session KPIs for three athletes in the browser.
Import the export you already have
Drop your Catapult, STATSports, Oliver Sports or WIMU CSV into Fractall and chart distance, high speed running, sprint distance and max velocity across the microcycle, beside RPE and wellness. One-month free trial, no card.
FAQs
Common questions about GPS speed and distance metrics
What speed counts as a sprint in football?
What is high speed running on GPS?
Are Zone 5 distance and high speed distance the same thing?
What is a good distance per minute?
Do speed and distance metrics replace internal load monitoring?
Related guides
Two Games a Week: What Wellness Data Shows Before Match 2
Fractall data on football teams playing two games a week: on match morning, fatigue sits less than half as far above normal. How to read wellness between games.
ChatGPT and Claude for Strength and Conditioning Coaches
What an S&C coach can ask ChatGPT or Claude about squad load, wellness and injuries, and the privacy settings to change before any athlete data goes in.
CMJ Test: Protocol, Norms and Why Devices Disagree
The same countermovement jump reads nearly 7 cm apart on a force plate, a phone app and a sensor. Triple the U16 to U18 gap. The protocol and the norms.