

4 Weeks Free Access (cancel anytime)
In-seasonIn-seasonTraining loadACWR

In-Season Training Load: The First Four Weeks

In-season training load changes shape the week fixtures start. What happens to chronic load and ACWR in your first four weeks, and how to run them without GPS.

Published
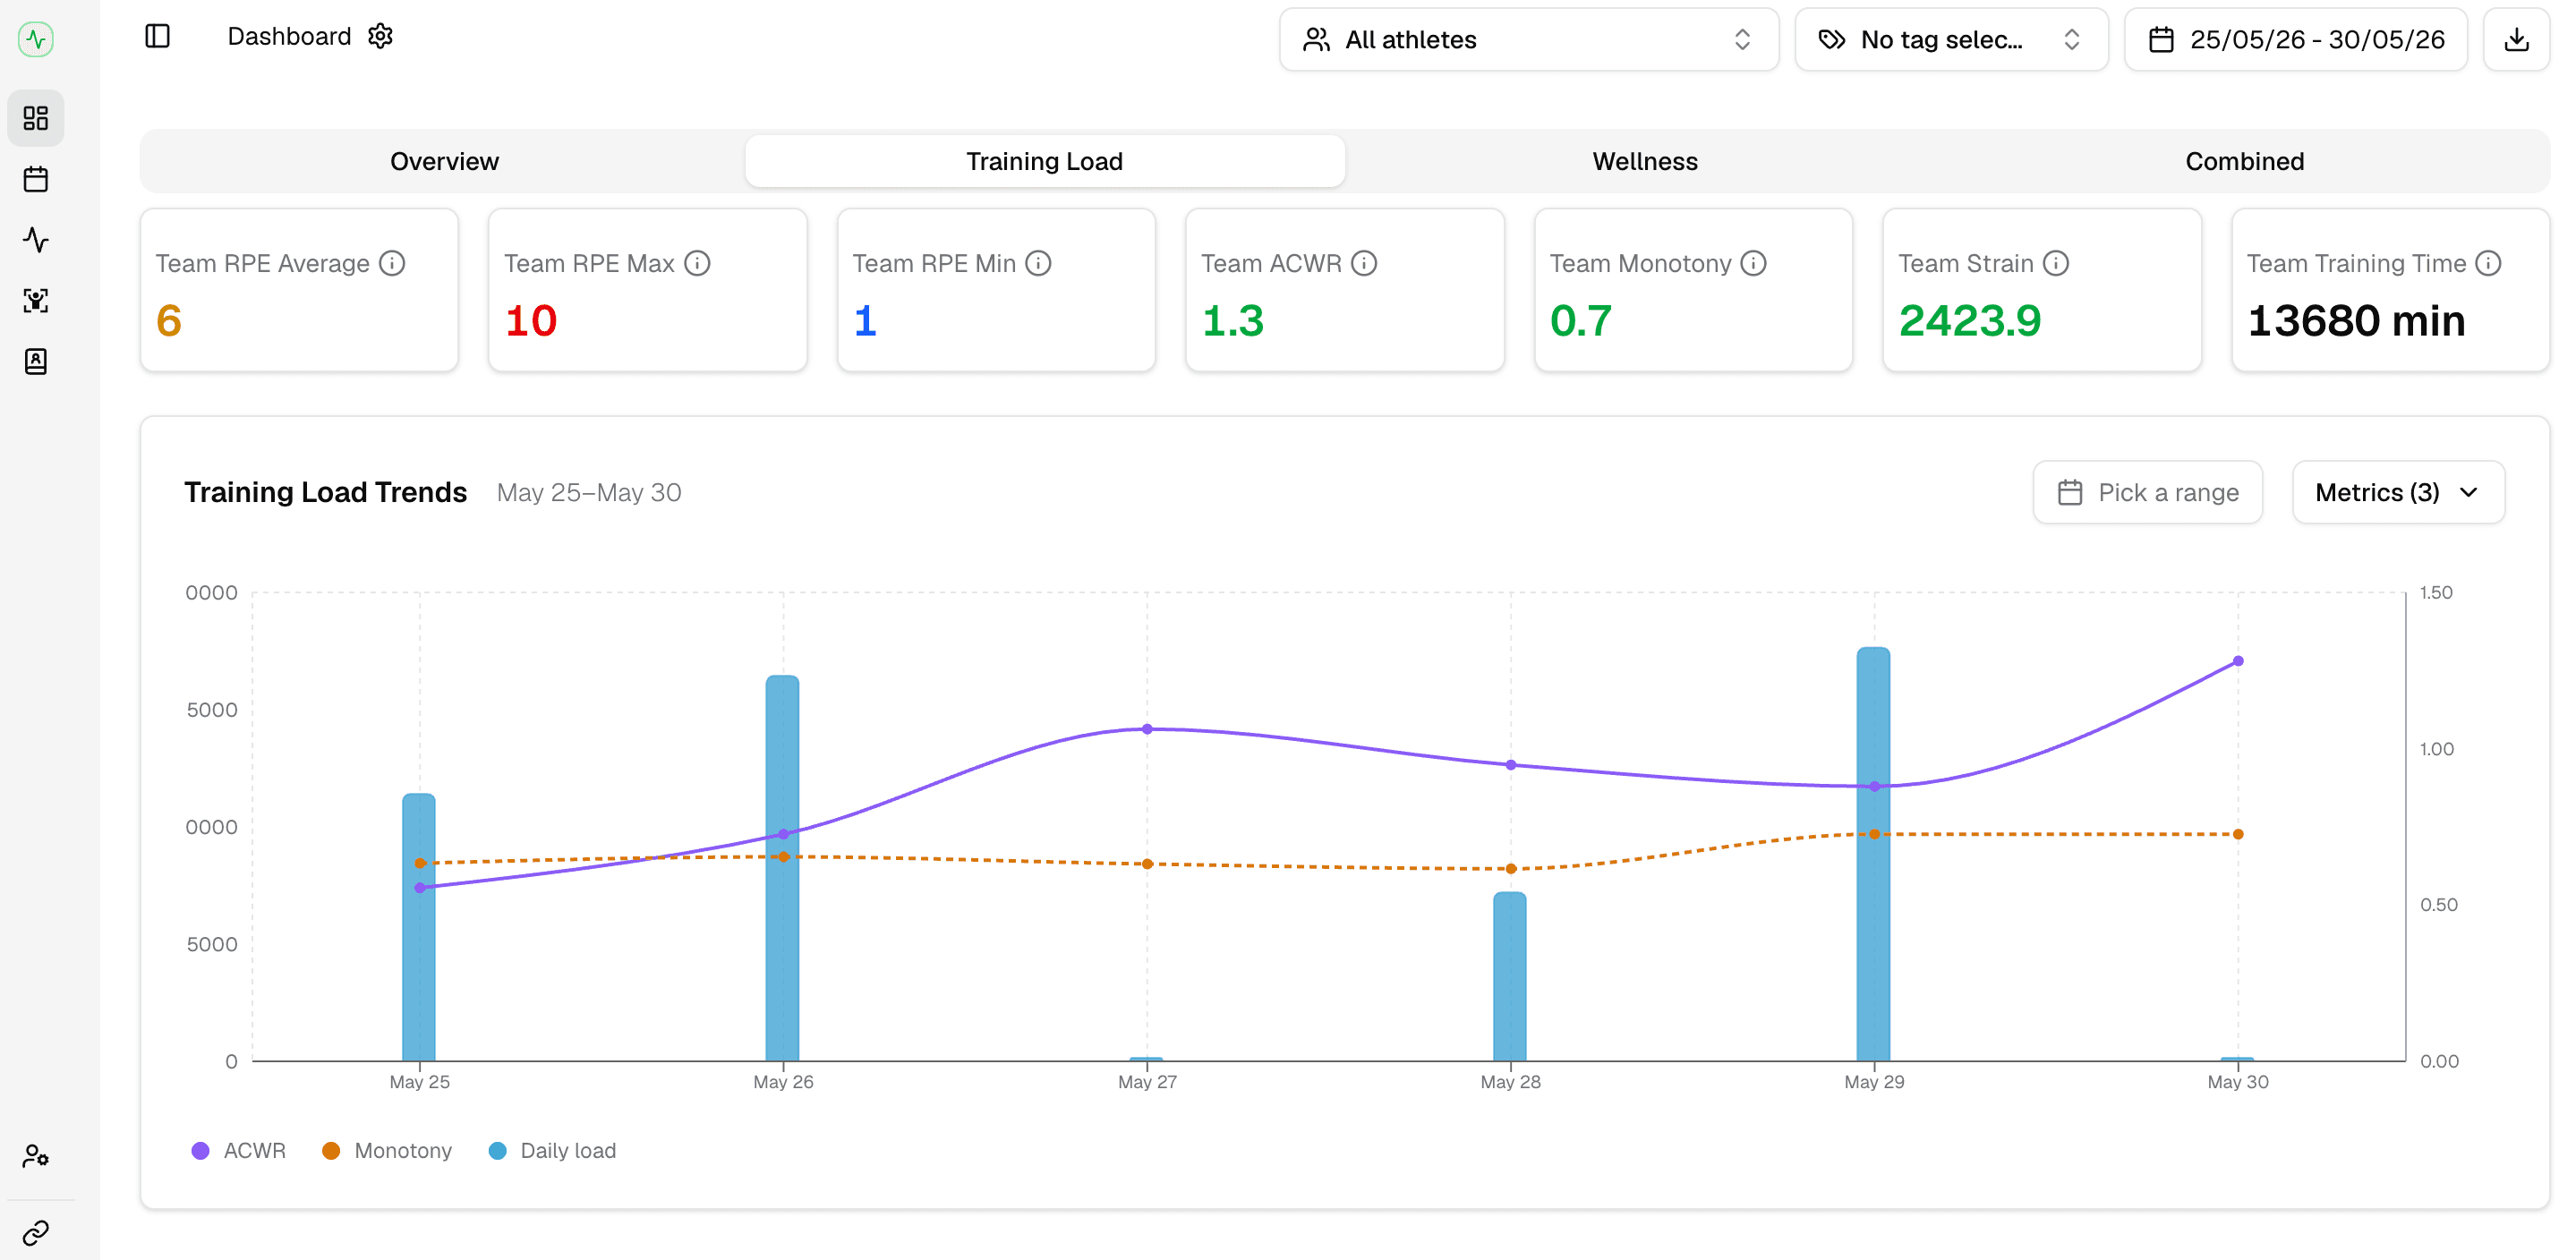
Fractall coach dashboard showing weekly training load and ACWR trends as a squad moves from pre-season into competition.

Quick answer

In-season training load arrives with fewer training days than a pre-season week and one match you don't control. It also stops landing evenly across the squad. Hold the loading pattern rather than cutting it, and expect your acute:chronic workload ratio to read oddly for about four weeks while the 28-day chronic window fills with competition data instead of pre-season data. In one elite squad tracked across that exact step, every external load measure was carried into competition unchanged except the highest-intensity accelerations and decelerations (Oliveira et al., 2024, 14 players).

Week one

What changes in training load when the season starts

Selection is the change that matters most, and it's the one least visible in a weekly total.

Your pre-season block was easy to monitor because every week looked like the last one. Five sessions, the whole squad in all of them, load you controlled directly. Competition takes that away. Training days come down and a match you don't control appears in the middle of the week. The bigger change is that the squad stops training as one group, because eleven players now accumulate 90 minutes that nobody else does.

32.5 km

Accumulated distance in a two-match week

Against 25.9 km in a one-match week for the same Premier League squad. Training frequency held at four sessions in both, and dropped to two in three-match weeks (Anderson et al., 2016).

+25%

Sprint distance for starters over non-starters

Across the same 31 players, weekly total distance differed by 0.25%. Weekly volume shows almost none of that difference (Varjan et al., 2023).

0.4 to 3.39

Range of ACWR values recorded across a season

Pooled from 27 studies of professional soccer. The ratio travels a long way over a season, and phase changes are part of why (Rico-González et al., 2024).

The instinct at this point is to cut training, on the logic that matches are now doing the work. The elite practice that has been measured points the other way. When a Portuguese women's first team was tracked across the last pre-season microcycle and the first competitive one, total distance, high-speed running and lower-intensity accelerations were all maintained. Only the most explosive accelerations and decelerations came down. That squad was 14 players at one club, so treat it as a worked example rather than a rule, though it matches the wider finding that a chronic load base only keeps its protective association while it's being maintained.
Last pre-season weekFirst competition week
Training sessionsFive, whole squadThree, whole squad
Match minutesFriendly, minutes shared aroundFixture, minutes concentrated in eleven players
Load across the squadNear identical for everyoneSplit by selection
A starter's weekly loadHigh and stableSimilar total, different shape
A non-starter's weekly loadHigh and stableFalls, and nothing flags it

The pre-season you just finished is still working for you

In elite rugby league, completing 10 additional pre-season sessions was associated with a 17% reduction in the odds of injury in the following week, and predicted 5% fewer games missed (Windt et al., 2017, 30 players). That's rugby league rather than football, so don't quote it as a football number. The football-adjacent evidence is softer: in elite Gaelic football, players who completed more than half of pre-season recorded 14.9 injuries per 1000 hours against 24.5 for those who completed less, but the difference didn't reach statistical significance in a squad of 25 (Fisher et al., 2022). Both point the same way without settling the question.
Sources: Anderson L et al. (2016), quantification of training load during one-, two- and three-game week schedules in English Premier League players. Varjan M et al. (2023), Journal of Human Kinetics 90:125–135. Rico-González M et al. (2024), systematic review of ACWR and training monotony across the season in professional soccer. Oliveira R et al. (2024), PLoS ONE 19(12):e0314076. Windt J et al. (2017), British Journal of Sports Medicine. Fisher P et al. (2022), Sports 10(8):117.

The arithmetic

Why your load numbers stop making sense for a month

The rolling windows behind your metrics are still full of a training phase that has ended.

Your chronic load is still mostly pre-season

A 28-day chronic window in the first week of the season contains three pre-season weeks and one competition week. Chronic load reads high because pre-season volume is still in it. Acute load has just dropped. So the ratio reads low, and it will keep reading low for two or three weeks while the window turns over. By week four the chronic window is entirely competition data and both numbers mean something again. During those four weeks the ratio is describing a change of phase, not a change in how prepared your players are.

What the ratio is actually good for

In 48 professional players across two elite European teams, an in-season acute:chronic ratio above 1.00 and below 1.25 was associated with lower injury risk than the reference group at 0.85 or below, and low chronic load combined with a sharp acute spike was associated with higher non-contact injury risk (Malone et al., 2017). That range is useful for deciding where to look. Treating it as a forecast goes past what the evidence supports: the 2024 systematic review that pooled 27 professional soccer studies concluded that ACWR and monotony have been criticised as injury-risk predictors, and recommended using them to understand how intensity varies across a season instead. Our ACWR dashboard is built on that framing, as a prompt to go and look at a player rather than a verdict on them.

Rolling averages make the phase change look worse

A flat 28-day rolling average treats a session from four weeks ago as heavily as yesterday's, so the pre-season tail hangs around at full weight and then falls off a cliff. An exponentially weighted average decays the older sessions and moves through the transition more smoothly. The difference between EWMA and rolling ACWR matters more in these four weeks than at any other point in the year.

Monotony behaves differently in a short week

Three sessions and a match produce a spikier week than five training days did. Monotony usually falls, which reads as a good thing, while strain concentrates around the match. Read them together rather than separately, and read them per player. The full method is in the guide to training monotony and strain.

Selection

The squad splits in two and your weekly totals won't show it

The players who stop playing lose intensity long before they lose volume, which is the hardest thing to catch by eye.

Thirty-one players at a Czech club were tracked over 14 weeks and 212 individual microcycles, split by whether they started. Weekly total distance between starters and non-starters differed by 0.25%. High-speed running differed by 14%, sprint distance by 25%, and acceleration and deceleration distance by 11%. A coach looking at weekly volume would conclude the squad was training evenly. It wasn't. The gap was widest on MD-1, and largest for fullbacks, attacking midfielders and forwards.

Why this compounds

One week of missed sprint exposure is nothing. Ten weeks of it leaves you with a player whose chronic load looks acceptable and whose top-speed exposure has quietly disappeared. Then he starts, plays 90 minutes, and hits sprint volumes he hasn't seen since July. The authors of that study recommended compensating the shortfall with extra high-intensity work in football-specific conditions, and arranging reserve fixtures where possible.

Catching the gap in the first four weeks

  • Log minutes played for every fixture, including the players who got none.
  • Group players by minutes played each week rather than by position when you review load.
  • Compare each player against their own pre-season average, not against the squad mean.
  • Give MD-1 a top-up for anyone who hasn't played, and put the intensity in it rather than the volume.
  • Watch the players who dropped out of the starting eleven recently, not just the permanent bench.

A warning about sRPE here

sRPE multiplies effort by duration, so it tracks volume well and intensity only partly. In the study above, the measure that barely moved between starters and non-starters was total distance. If your only input is sRPE, the intensity gap can stay invisible. Pairing session load with minutes played is what makes it show up, and it costs nothing to collect.
Varjan M, Hank M, Kalata M, Chmura P, Mala L, Zahalka F (2023). Weekly training load differences between starting and non-starting soccer players. Journal of Human Kinetics 90:125–135. 31 male players, 212 microcycle records over 14 weeks.

The procedure

How to manage training load in the first four weeks

Four weeks is roughly how long it takes for your chronic window to become a competition window.

  1. 1

    Week 1: set the match reference and hold the pattern

    Log the fixture as a session like any other, using RPE multiplied by minutes actually played. That single number becomes your reference for the rest of the season. Resist cutting training volume this week. You have one match of evidence and no reason yet to change anything.

  2. 2

    Week 2: start reading individuals, stop reading the team

    The squad average is now the average of two different training weeks and it will stay misleading until selection settles. Pull up the players with the highest and lowest minutes and look at those two groups separately. Add a compensation block for anyone on zero minutes.

  3. 3

    Week 3: expect chronic load to fall, and let it

    Half your chronic window is competition data now, so chronic load drops and the ratio climbs toward normal. This is the window turning over rather than fitness disappearing. Compare each player against their own pre-season baseline before you act on anything.

  4. 4

    Week 4: re-baseline and start trusting the numbers again

    The chronic window is fully competition data. Take a new baseline per player here and treat it as the reference for the rest of the block. From this point the acute:chronic ratio is describing your season rather than your transition, and the aim shifts to keeping weekly changes gradual.

What to check every week during the transition

  • Minutes played per athlete, including the zeros.
  • Weekly load per athlete against their own pre-season average.
  • Wellness and pain reports for anyone whose minutes jumped from bench to full match.
  • Whether the week's shape matches the plan, not just whether the total does.
  • Any player whose load has fallen for two weeks running without an injury reason.
Once the four weeks are done and selection has settled, the job becomes ordinary match-week planning. The load rhythm from MD-4 through to MD+1 carries the rest of the season, and congested weeks are handled by reducing training rather than by rebuilding the method.

No hardware

How to monitor in-season training load without GPS

Every decision above can be made from sRPE, minutes played, and a daily wellness check.

The research quoted here uses GPS because elite clubs have it. The decisions it supports don't require it. Session load is RPE multiplied by duration, chronic load is a rolling average of that, and the acute:chronic ratio falls out of the two. Minutes played comes off the team sheet. What you lose without GPS is the ability to see the sprint and high-speed gap directly, which is why minutes played does that job instead. Our guide to RPE and training load monitoring covers the collection method in full.

What you genuinely can't see without hardware

Sprint distance, high-speed running, and mechanical load from accelerations and decelerations. If a player's top-speed exposure is the thing you're worried about, minutes played and a weekly sprint exposure you schedule yourself are the substitutes. Neither substitute matches a GPS trace for precision, though both beat a spreadsheet that records nothing about intensity.

In practice

Run the transition without rebuilding your spreadsheet

The first four weeks are where spreadsheet monitoring usually breaks: rolling windows have to be recalculated per athlete, matches have to sit alongside sessions, and the squad average stops being useful exactly when you start relying on it.

Fractall in-season loop

1

Athletes submit RPE, wellness, and body pain on their phone after training and after matches.

2

Fractall calculates internal load, ACWR, monotony, and strain automatically as the chronic window turns over.

3

The coach dashboard flags load drops, falling wellness, and rising pain by player rather than by team average.

4

Export a PDF at the end of the block to review the transition with staff before the fixtures compress.

Setup needs no hardware and the calculations update themselves. Because it's the same loop you ran through pre-season, each player's July baseline stays in the system as the comparison point once the chronic window has turned over.

Monitor the season transition without spreadsheets

Collect sRPE and wellness, calculate ACWR and monotony automatically, and see which players are quietly losing load.

Try Fractall free

FAQs

In-season training load questions

Does training load go down when the season starts?

Weekly training volume goes down because you have fewer training days. Total load often doesn't, because the match replaces what you removed. In a Premier League squad, a two-match week accumulated 32.5 km against 25.9 km in a one-match week. The size of the week changes less than how unevenly it lands across the squad.

What should ACWR be in the first weeks of the season?

Treat it as unreliable for about four weeks. Your 28-day chronic window is still full of pre-season, so the ratio reads low and tells you little. Once the window has turned over, the in-season range associated with lower injury risk in professional soccer was above 1.00 and below 1.25, against a reference group at 0.85 or below (Malone et al., 2017, 48 players). Use it to decide who to look at, not to decide who plays.

Why does my chronic load look wrong at the start of the season?

Because it's averaging two different training phases. In week one, three of the four weeks in the window are pre-season weeks with higher volume. Chronic load reads high, then falls week by week as competition data replaces it. Re-baseline each player at week four and compare forward from there.

How do I load players who aren't getting minutes?

Give them the intensity, not the volume. Weekly total distance between starters and non-starters differed by only 0.25% in one squad of 31, while sprint distance differed by 25%. Top-ups on MD-1 with high-intensity, football-specific work close the right gap. Reserve fixtures do it better when you can arrange them.

Do injuries spike at the start of the season?

It depends on the league, which is a more useful answer than yes. In 2018-19, the Premier League recorded 74.8% of its season injuries in the first half of the campaign, with 13.3% in August alone. LaLiga over the same season split almost evenly across the two halves, and recorded 2.8% in August. Fixture calendars and season start dates differ enough that the pattern in your competition is worth checking before you plan around someone else's (Argibay-González et al., 2022, 277 injuries across two leagues in one season).

Related guides