

1 Month Free Access (cancel anytime)
Youth footballPhysical testsInjury prevention

Peak Height Velocity in Football: A Guide for S&C Coaches

Peak height velocity in academy football: a free calculator for growth rate and maturity offset, how to measure height, and what to change in training.

Published
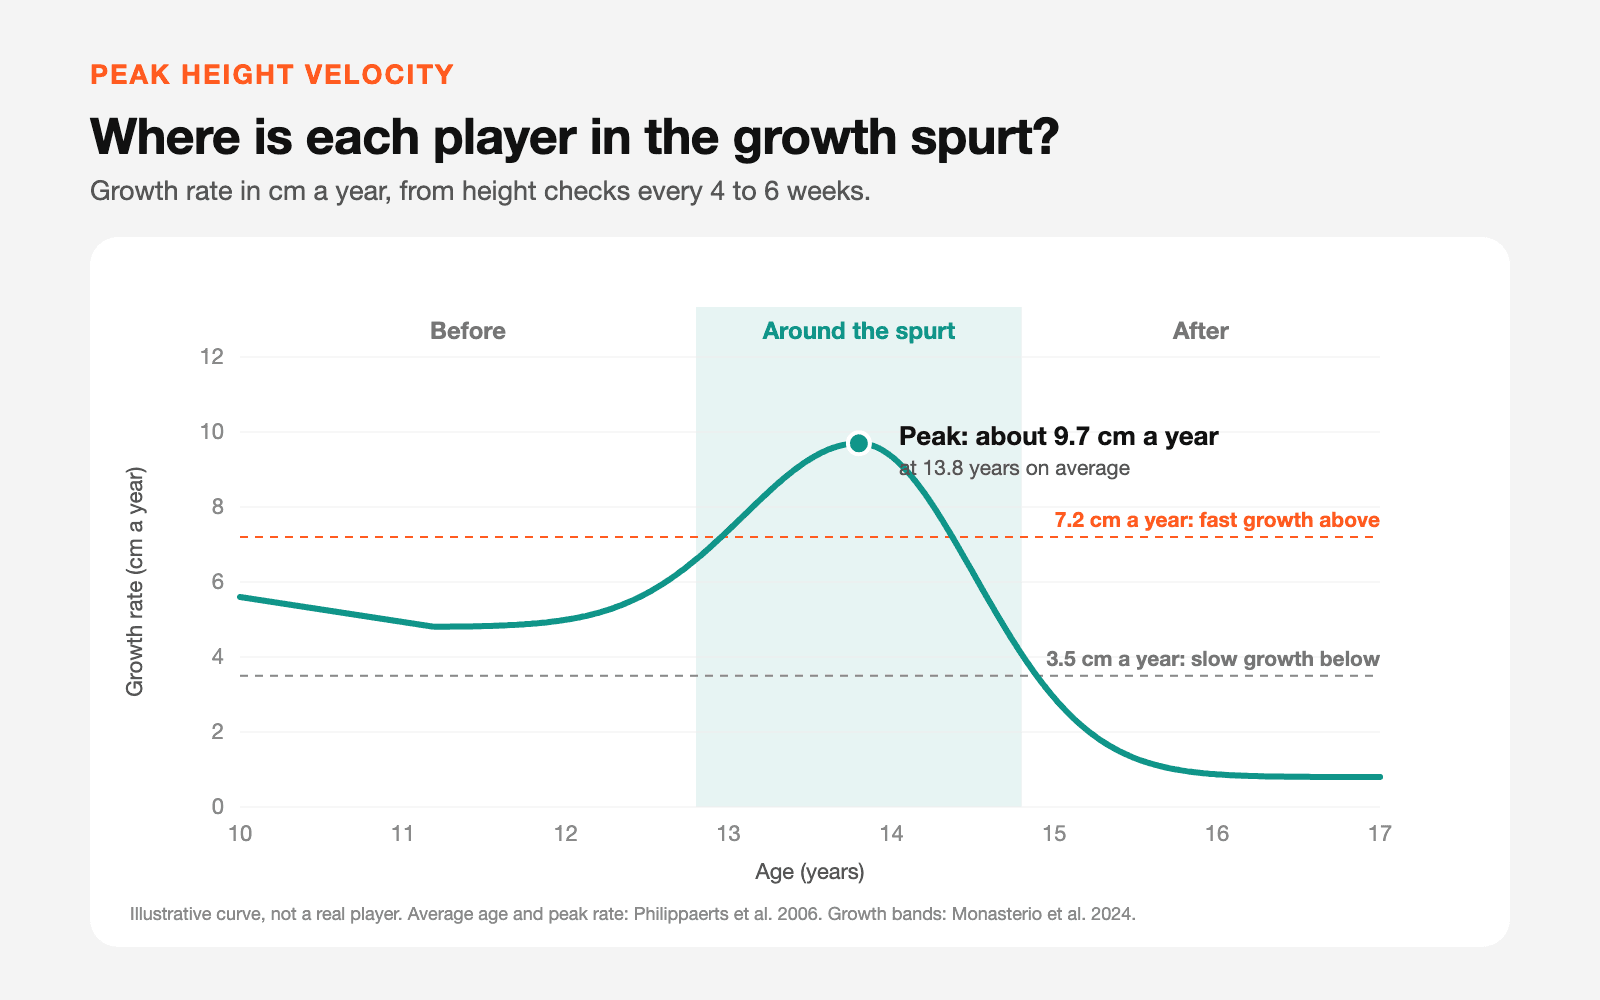
Illustrative growth curve of a boy in football: growth rate in cm per year by age, rising from about 5 cm a year at age 11 to a peak of about 9.7 cm a year near age 13.8, then falling. The year either side of the peak is shaded as around the spurt, with dashed lines at 3.5 and 7.2 cm a year marking slow, moderate and fast growth.

Peak height velocity

The short answer

Measure height regularly, read the growth rate over months, and adjust training for the fastest growers.

Quick answer

Peak height velocity (PHV) is the point in the adolescent growth spurt when a player grows fastest. In football studies, boys reach it at about 13.6 to 13.8 years, growing around 9.7 cm a year. To see where each player is, measure standing height every 4 to 6 weeks, turn the change into cm a year, and read the trend over three months or more. Players growing faster than about 7.2 cm a year are the ones to watch.
Below: when the spurt happens, what the injury research does and doesn't show, how to measure, how to turn heights into a growth rate (with a calculator), what the equations can and can't tell you, what to change in training, and which pain goes straight to the physio.

Timing

1. On average, boys in football peak at about 13.5 to 14, and the spread is wide

Two players in the same U14 squad can be two years apart in growth.

Peak height velocity (PHV)

The fastest rate of growth in height during the adolescent growth spurt, measured in cm per year, and the age at which it happens.

Example: A player who grew 2.4 cm in the three months around his 14th birthday was growing at about 9.6 cm a year.

13.8 years

Average age at peak height velocity in a group of Belgian youth football players

Peak growth was 9.7 ± 1.5 cm a year (Philippaerts et al. 2006, 33 players followed for five years). A 2024 study of 58 players found 13.6 years (Malina et al. 2024).

The average hides the range: a spread of nearly a year either way is normal. In the 2024 study, the standard deviation was 0.9 years, and the spurt started (the take-off) at 11.2 years on average. Across 13 football samples, players in northern Europe peaked later than those in southern Europe (Malina et al. 2024). The fast-growth phase lasts roughly two years, about a year either side of the peak (Cumming et al. 2017).
Girls reach the peak earlier, at around 11.5 years (Hall and Erskine 2025). This guide focuses on boys because that is where the football evidence is: a 2025 review found no study of growth and injury in female academy players.
Performance moves with growth too. In the Belgian study, several physical qualities improved fastest around the peak, and flexibility improved fastest in the year after (Philippaerts et al. 2006). That matters when you read a U14's test results against the norms in our guide to physical tests for small clubs.
Philippaerts RM et al. (2006), J Sports Sci 24(3):221-30, doi:10.1080/02640410500189371. Malina RM et al. (2024), Biol Sport 41(1):135-44, doi:10.5114/biolsport.2024.127385. Cumming SP et al. (2017), Strength Cond J 39(2):34-47. Hall ECR, Erskine RM (2025), Sports Med, doi:10.1007/s40279-025-02340-0.

Injury

2. Growth-related injuries cluster around the spurt, and the evidence is still weak

Strong enough to watch growth closely, too weak to predict any one player's injury.

24.5 vs 11.5

Non-contact and overuse injuries per 1000 match hours, around the spurt vs before it

76 academy players over two seasons (Johnson et al. 2020). An association, counted on match hours only.

Growing fast is the clearest warning sign in the football research. Players who grew 0.6 cm or more in a month were more likely to get injured (odds ratio 1.63, Kemper et al. 2015). In one elite academy, players growing faster than 7.2 cm a year had more growth-related injuries at every stage of maturity (Monasterio et al. 2024), and players with a fast peak carried about three to four times the growth-related injury burden of average and slow growers (Monasterio et al. 2023).
The weak point is the quality of the evidence. A 2025 systematic review rated its certainty "very low" (Pakarinen et al. 2025). Another 2025 review found that growth-related injuries cluster around the peak, while players past it had more injuries overall (Hall and Erskine 2025). The fair summary: the spurt is a period to watch closely, and growth rate is the most practical thing to watch. It won't tell you which player will get injured.
Johnson DM et al. (2020), Eur J Sport Sci 20(4):544-52, doi:10.1080/17461391.2019.1633416. Kemper GLJ et al. (2015), Int J Sports Med 36(13):1112-7, doi:10.1055/s-0035-1555778. Monasterio X et al. (2023), Int J Sports Med 44(4):292-7, doi:10.1055/a-1983-6762. Monasterio X et al. (2024), Biol Sport 41(1):235-44, doi:10.5114/biolsport.2024.129472. Pakarinen O et al. (2025), Health Sci Rep 8(7):e71096, doi:10.1002/hsr2.71096.

Measuring

3. Measure standing height every 4 to 6 weeks, the same way each time

A growth rate is only as good as the two heights behind it.

Measure the whole squad at least three times a year, and monthly for anyone close to or in the spurt. That is what a review of maturity in youth football suggests (Towlson et al. 2021), and monthly measurement is what the study linking growth to injury used (Kemper et al. 2015). Every 4 to 6 weeks for everyone is simpler to run and covers both.
  1. 1

    Use a stadiometer, or a tape fixed to a wall

    Barefoot, heels together and against the wall, head level, with the lower edge of the eye socket level with the notch in front of the ear.

  2. 2

    Read at the end of a normal breath out

    Record to the nearest 0.1 cm. Rounding to whole centimetres wipes out a month of growth.

  3. 3

    Same person, same time of day

    Height changes over the day, so pick a slot, such as before the first session of the week, and keep it (Towlson et al. 2021).

  4. 4

    Write down the date with every height

    The growth rate needs the time between readings, so a height without a date is no use.

Measuring adds a few minutes per squad, and it is data about minors. Tell parents what you record and why, and keep it to the staff who need it.
Towlson C et al. (2021), J Sport Health Sci 10(4):403-12, doi:10.1016/j.jshs.2020.09.003. Kemper GLJ et al. (2015), Int J Sports Med 36(13):1112-7.

Growth rate

4. Turn heights into cm a year, and read the trend over three months or more

Two readings six weeks apart are too noisy on their own.

The growth rate is the change in height divided by the time between the two readings, scaled to a year: (latest height − earlier height) ÷ weeks between them × 52. A player who grew 1.2 cm in 6 weeks is growing at about 10.4 cm a year.
The catch is measurement error. A trained measurer is off by about 0.23 cm on a single reading (Monasterio et al. 2024). By our calculation, the difference between two readings then typically carries about ± 0.33 cm of noise. Over 6 weeks that is ± 2.8 cm a year, about a third of what a player at the peak grows. Over 12 weeks it halves.
Here is an example player (invented for this guide) measured every 6 weeks:
Readings comparedGrowth rateTypical error from measuring alone
Week 0 to week 6 (151.0 to 151.9 cm)7.8 cm a year± 2.8 cm a year
Week 6 to week 12 (151.9 to 153.1 cm)10.4 cm a year± 2.8 cm a year
Week 12 to week 18 (153.1 to 154.0 cm)7.8 cm a year± 2.8 cm a year
Week 0 to week 12 (151.0 to 153.1 cm)9.1 cm a year± 1.4 cm a year
Week 0 to week 18 (151.0 to 154.0 cm)8.7 cm a year± 0.9 cm a year
The six-week readings jump between 7.8 and 10.4 cm a year; the 18-week reading says 8.7, and that is the number to act on. This player is growing fast (above 7.2 cm a year) and is very likely in the spurt. Keep measuring every 4 to 6 weeks, and read each new height as one more point on the line.
The bands come from that same academy study: below 3.5 cm a year is slow, 3.5 to 7.2 is moderate, and above 7.2 is fast (Monasterio et al. 2024). Towlson et al. (2021) add that growth curves need about two years of data before they stop misleading you, so the first season of measuring is the hardest to read.
Monasterio X et al. (2024), Biol Sport 41(1):235-44, measurement error 0.23 cm (intra-rater typical error). The noise figures are Fractall's calculation: √2 × 0.23 cm, scaled to a year.

Calculator

Growth rate and maturity offset calculator

Enter two heights and the weeks between them, or a boy's age and height.

Where is this player in the growth spurt?

Part 1 turns two dated heights into cm a year and shows how much of it could be measurement error. Part 2 estimates years from the peak for boys, from age and height only.

1. Growth rate from two height checks

Growth rate

8.7 cm a year

Fast growth

Above 7.2 cm a year. In the football studies behind this guide, fast growers had more growth-related injuries.

Measurement error alone typically moves this by about ±1.4 cm a year at this interval.

2. Years from peak height velocity (boys, height and age only)

Estimated maturity offset

-0.6 years

Around the spurt

Within about a year of the estimated peak. Estimated age at peak: 13.6, give or take about 0.5 years.

Part 1 uses the growth bands from Monasterio et al. (2024); the error line is our calculation from a 0.23 cm error per reading. Part 2 uses the height-only boys' equation from Moore et al. (2015). It tends to place the peak too late for early maturers and too early for late maturers (Kozieł and Malina 2018), so use the category and treat the age as rough. The starting values are an example, not a real player.

Equations

5. Use an equation to sort players into before, around and after the spurt, never to date it

Every shortcut has an error of about half a year, and a known bias.

Most PHV guides point you to the Mirwald equation (Mirwald et al. 2002). It needs sitting height and leg length, which most academies don't measure. Moore et al. (2015) published a boys' version that needs only age and standing height, and that is the one in the calculator above: maturity offset = −7.999994 + 0.0036124 × age × height (cm). A 13-year-old who is 158 cm tall gets −0.58: about seven months before his estimated peak.
MethodWhat you needHow far to trust it
Growth rate from repeated heightsStanding height every 4 to 6 weeksThe most direct read, once you have three months or more of measurements
Moore height-only equation (boys)Age and standing heightAbout ± 0.5 years; later than the truth in early maturers, earlier in late maturers
Mirwald or Moore sitting-height equationAge, standing height, sitting height (Mirwald also needs weight)Same error and the same bias as above
Percentage of predicted adult height (Khamis-Roche)Age, height, weight, and both parents' measured heightsCaught the peak in 22 of 23 academy players in one study; built on white American children
The equations are biased in the players you most need to get right. They place the peak too late in early maturers and too early in late maturers (Kozieł and Malina 2018). In a Polish study, the prediction was close only about two years before the real peak (Malina and Kozieł 2014). The original authors themselves advised treating the result as a category rather than a number (Mirwald et al. 2002).
If you have both parents' measured heights, the Khamis-Roche method predicts adult height, and the player's current height as a share of it did better in the one study that compared them. In that Premier League academy, the window of 85 to 96% of predicted adult height caught the peak in 22 of 23 players, against 14 of 23 for age or maturity offset (Parr et al. 2020). It was built on white American children (Khamis and Roche 1994), and parents' self-reported heights add error. We left it out of the calculator because it needs coefficient tables we haven't checked against the original paper.
Mirwald RL et al. (2002), Med Sci Sports Exerc 34(4):689-94, doi:10.1097/00005768-200204000-00020. Moore SA et al. (2015), Med Sci Sports Exerc 47(8):1755-64, doi:10.1249/mss.0000000000000588. Equation as reproduced in Kozieł SM, Malina RM (2018), Sports Med 48(1):221-36, doi:10.1007/s40279-017-0750-y. Malina RM, Kozieł SM (2014), J Sports Sci 32(5):424-37, doi:10.1080/02640414.2013.828850. Khamis HJ, Roche AF (1994), Pediatrics 94(4):504-7, doi:10.1542/peds.94.4.504. Parr J et al. (2020), Ann Hum Biol 47(4):400-8, doi:10.1080/03014460.2020.1782989.

Training

6. During the spurt, adjust load and add balance, landing and strength work

We found one study that has tested this in academy football. Here is what it did.

The only intervention study we found in academy football flagged players on three signs and changed their programme when two were present. The flags were: between 88 and 92.8% of predicted adult height, growing 7.2 cm a year or more, and lower-limb growth of 3.6 cm a year or more. Flagged players, and anyone with symptoms, got adjusted training load, football-specific skill work, balance, coordination and landing drills, and an individual strength programme (Johnson et al. 2023).
Injuries fell sharply in the players with all three flags, from 5.2 to 0.8 per 1000 hours, and didn't change in the rest. The study compared seasons before and after, with no control group, and the paper's summary doesn't say how much load was cut. None of the studies we read gives a percentage to cut by, so a figure you read elsewhere is a practitioner's choice.

A starting routine for the fastest growers

  • List the players growing above 7.2 cm a year over the last three months or more.
  • Look at their week: matches and sessions across every team they play for, plus PE and other sports.
  • Avoid sudden jumps in their load from one week to the next. Session RPE makes the jumps visible.
  • Give them regular balance, coordination and landing work, and an individual strength programme.
  • Ask about knee and heel pain at every check, and send any pain to the physio.
  • Expect some players to look less coordinated for a while. Research on this is mixed, so judge each player rather than assuming it (Quatman-Yates et al. 2012).
To see load jumps in a growing player's week, track session RPE and read it with the acute to chronic workload ratio (ACWR), gently: one high week matters less than a pattern.
Johnson D et al. (2023), Ann Hum Biol 50(1):452-60, doi:10.1080/03014460.2023.2261854. Quatman-Yates CC et al. (2012), Br J Sports Med 46(9):649-55, doi:10.1136/bjsm.2010.079616.

Pain

7. Knee pain below the kneecap and heel pain in a growing player go straight to the physio

Osgood-Schlatter and Sever's are two growth-related conditions common in academy football.

Pain at the bump below the kneecap, or at the back of the heel, in a player who is growing is a reason to call the physio the same week. In an audit of 38 English academies, growth-related conditions made up 5% of injuries. Osgood-Schlatter (knee) was most common at under 13 and Sever's (heel) at under 11 (Price et al. 2004). Those are age groups; the link to the spurt itself comes from narrative reviews (Cumming et al. 2017). Diagnosis and treatment are for medical staff.
What the coach can do is make the pain visible early. A daily body map lets a player mark a sore knee in seconds, before it turns into a missed session; our comparison of body pain mapping tools covers the options, and what to record when a player is injured covers logging it once the physio has seen it.
Price RJ et al. (2004), Br J Sports Med 38(4):466-71, doi:10.1136/bjsm.2003.005165. Cumming SP et al. (2017), Strength Cond J 39(2):34-47.

Bio-banding

8. Bio-banding narrows the maturity gap; its effects on fairness and injury are unproven

Grouping by maturity instead of birth year, and what it has shown so far.

Bio-banding groups players by maturity rather than by birth year, usually by percentage of predicted adult height. The Premier League ran bio-banded tournaments for players aged 11 to 14 who were between 85 and 90% of predicted adult height (Cumming et al. 2017). It reduces the maturity gap within a group, but doesn't remove it (Malina et al. 2019).
For injuries, the evidence is thin: its authors wrote there is "limited evidence" that bio-banding reduces injury risk (Cumming et al. 2017). Academies use it to give late developers a fairer game and early developers a harder one, though the evidence for that is limited too (Cumming et al. 2017). Keep injury prevention in the growth-rate routine above.
Cumming SP et al. (2017), Strength Cond J 39(2):34-47. Malina RM et al. (2019), Sports Med 49(11):1671-85, doi:10.1007/s40279-019-01166-x.

In Fractall

Height checks next to wellness, pain and load in Fractall

Record height with the rest of the physical tests; growth rate is still a calculation you do.
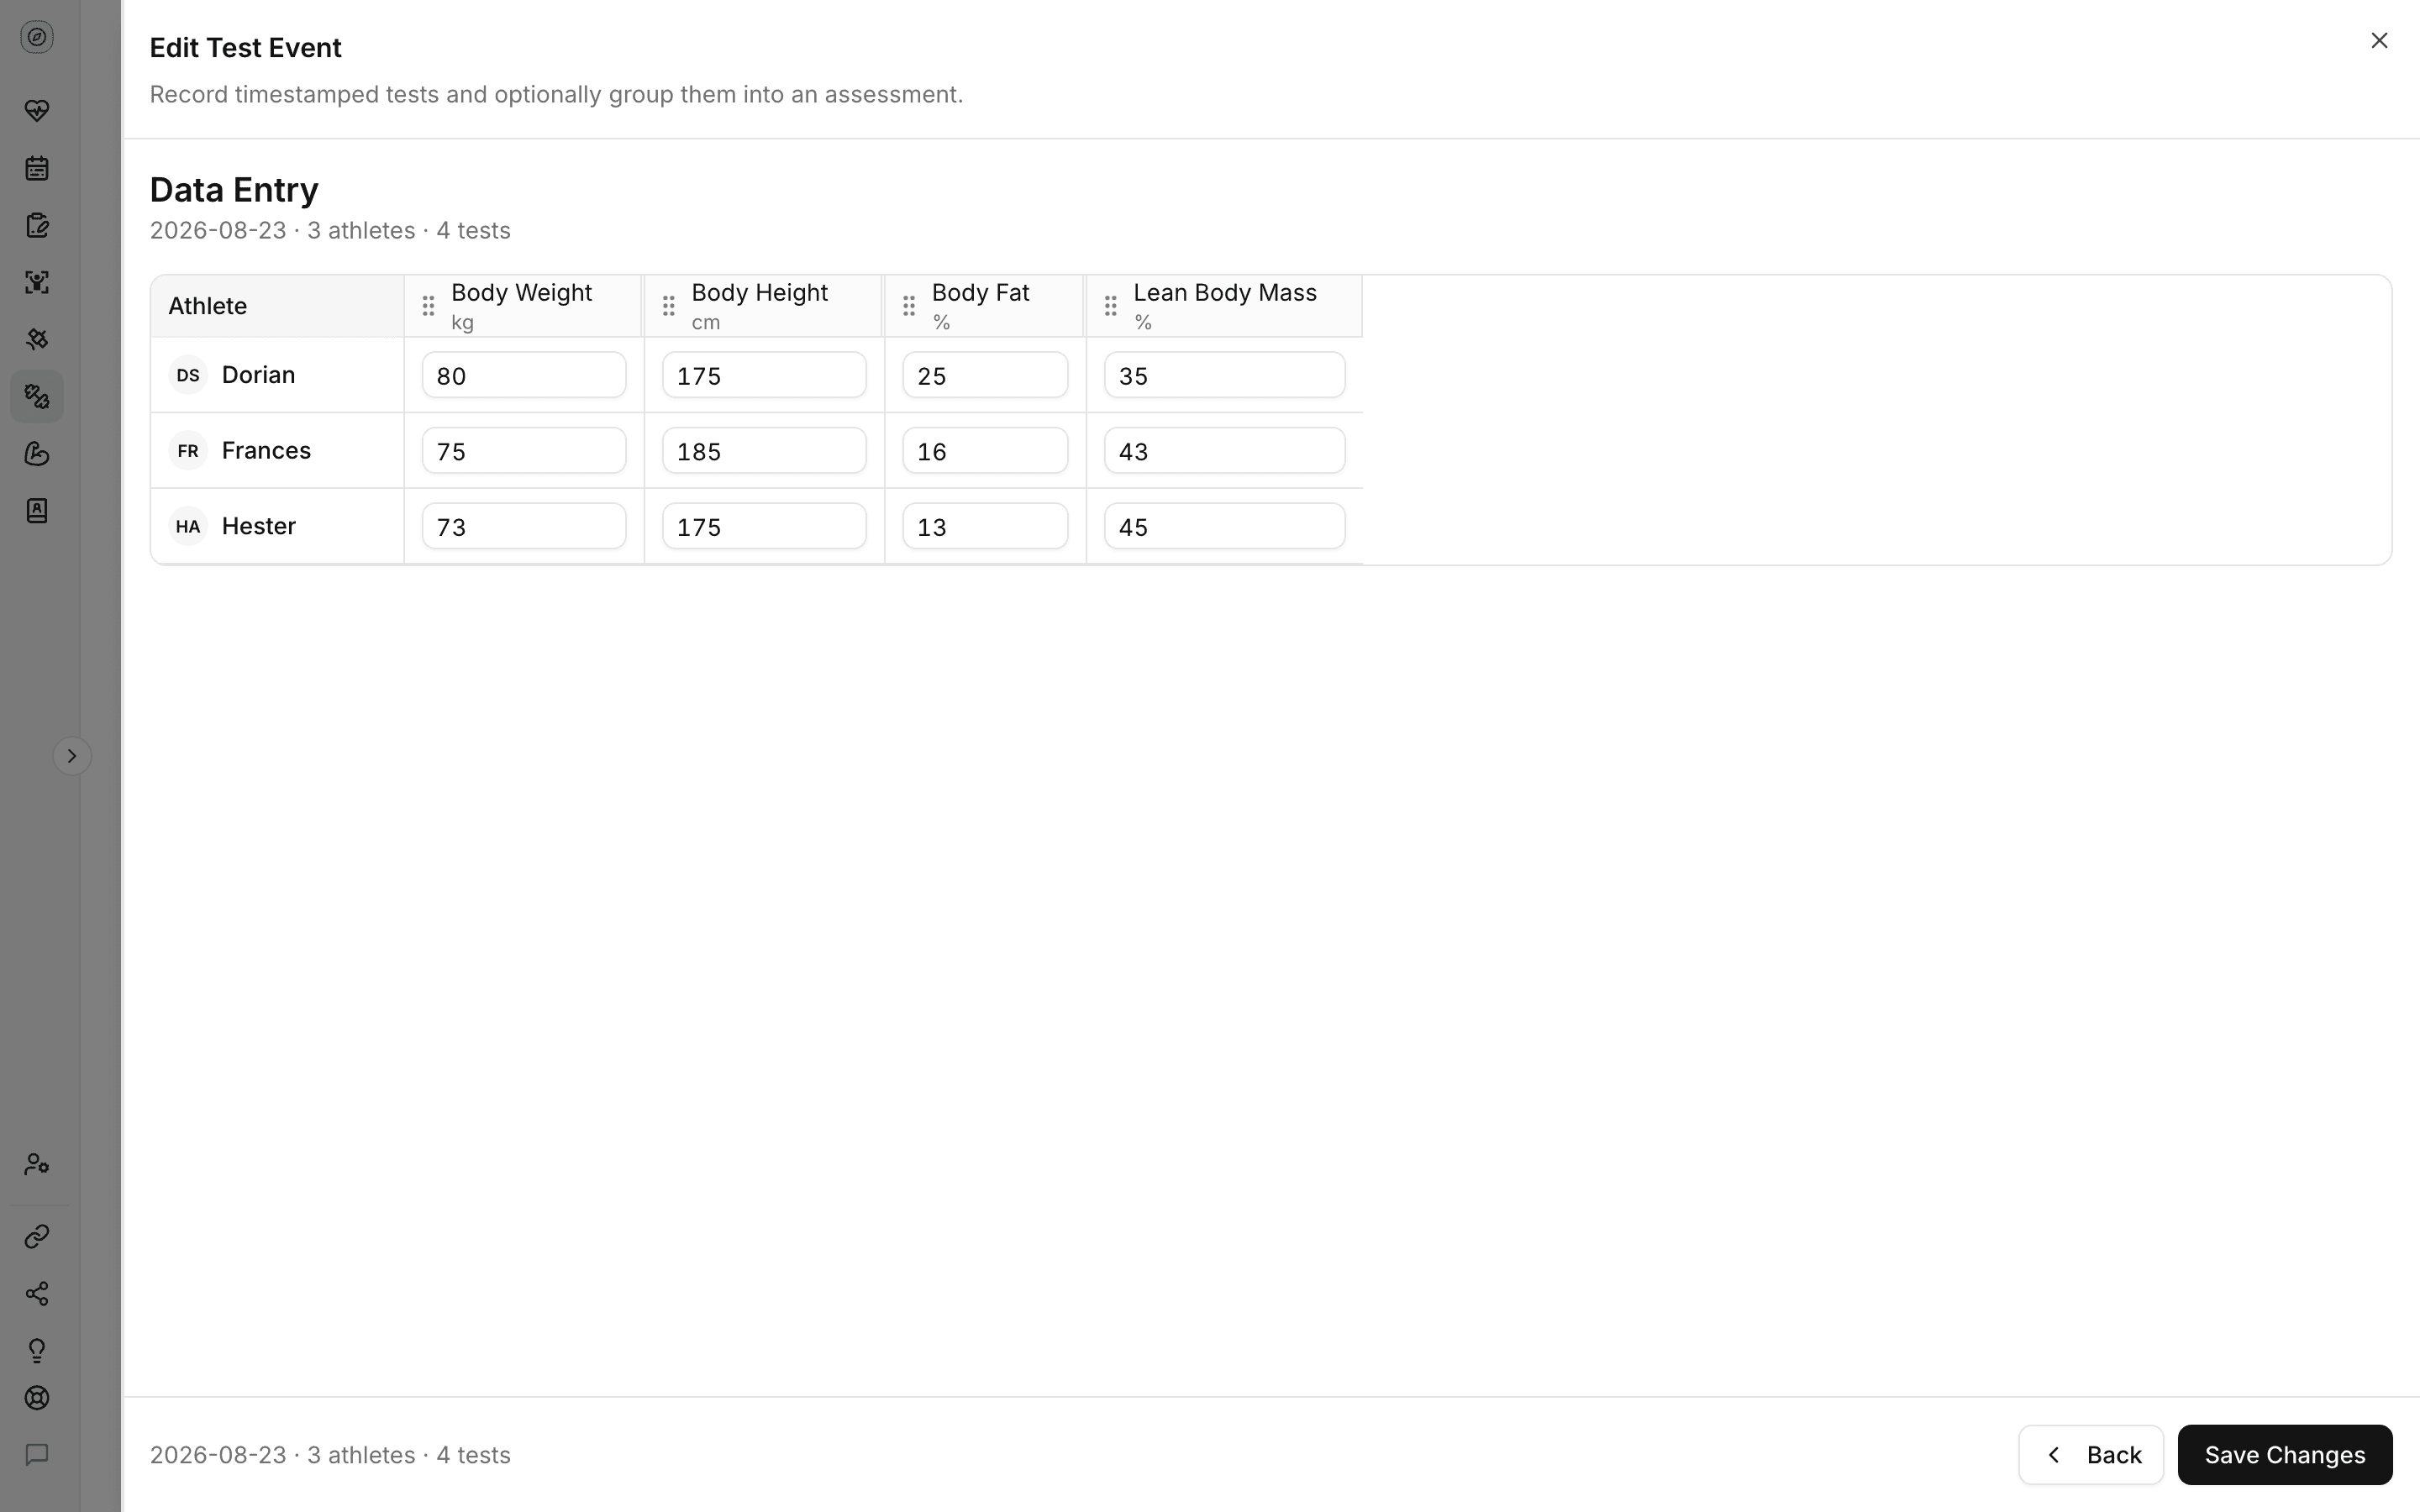
Fractall's physical tests include Body Height in the anthropometric category, with the same measuring protocol built in. You enter the whole squad in one grid, and every entry is dated.
Fractall data entry grid for a test event dated 2026-08-23, with body weight, body height, body fat and lean body mass columns for three demo athletes. Body height values are 175, 185 and 175 cm.
Entering body height for the squad in Fractall's physical tests. Demo data in whole centimetres; record your players to 0.1 cm.

A growth check in Fractall

1

Create a test event every 4 to 6 weeks and enter Body Height for the squad, to 0.1 cm.

2

Players see a history chart of their own test results in the Fractall app.

3

Players mark knee or foot pain on the body map in their daily wellness check, so you see it the morning it starts.

4

Read the fastest growers' session RPE and load next to their wellness before you plan their week.

Pain marked on the body map shows in wellness tracking next to the rest of the morning check, and once the physio has seen it, you record the diagnosis in injury monitoring.
On the Fractall connector for ChatGPT and Claude, in open beta, you can ask for every player's height entries and have the assistant work out cm a year for the squad.

What Fractall doesn't do yet

  • It doesn't calculate growth rate, maturity offset or percentage of predicted adult height. Use the calculator above or the connector.
  • Coaches don't get a height-over-time chart per player on the web dashboard yet; the history chart is in the player's app.
  • There are no fields for sitting height or parents' heights.
  • It doesn't flag fast growers or link growth to training load automatically.

Track height next to wellness and load

Record squad heights in physical tests, see knee and foot pain on the body map, and read session RPE for the same players. The first month is free.

Start free trial

Limits

What this guide can't tell you

Small studies, boys only, and an example player who doesn't exist.

Most of the football studies here followed between 23 and 124 players at one or a few academies, and every injury finding is an association. The growth bands and flags come from one or two academies and haven't been tested more widely.
The evidence is about boys. For girls the peak comes earlier, and the football research on growth and injury doesn't exist yet. The example player in section 4 is invented, and real players won't grow in a line this tidy.
A growth rate is not a diagnosis. Pain, a limp, or anything that worries you goes to the medical staff.

FAQs

Frequently asked questions

What coaches ask before they start tracking growth.

What is peak height velocity?

Peak height velocity (PHV) is the fastest rate of growth in height during the adolescent growth spurt, and the age at which it happens. In football studies boys reach it at about 13.6 to 13.8 years on average, with a spread of nearly a year either way, and grow about 9.7 cm a year at the peak.

How do you calculate peak height velocity?

Measure standing height every 4 to 6 weeks, divide the change by the weeks between two measurements, and multiply by 52 to get cm a year. The highest rate across the spurt is the peak. Because each reading carries some error, read the rate over three months or more rather than from two readings six weeks apart.

How often should you measure height in youth football players?

At least three times a year for every player, and monthly for players approaching or going through the growth spurt, as a review of maturity in youth football suggests (Towlson et al. 2021). Measuring every 4 to 6 weeks for the whole squad is a practical middle ground for most academies.

Is a maturity offset calculator accurate?

Only roughly. The equations estimate years from peak height velocity with a standard error of about half a year, and they place the peak too late in early maturers and too early in late maturers (Kozieł and Malina 2018). Use the result to sort players into before, around and after the spurt, and confirm it with their measured growth rate.

Should players stop training during the growth spurt?

We found no study that supports stopping. The only intervention study we found in academy football (Johnson et al. 2023) adjusted training load and added skills, balance, coordination, landing and individual strength work for players with two of three growth flags, or with symptoms. Injuries fell in the players with all three flags, but the study had no control group. Any player with pain goes to the physio.
How does your academy track growth, and what do you change for a player in the middle of the spurt? If you measure differently or have a routine that works, we would like to hear it.

Related guides